25Apr

SPDR Select Sector Fund ETF – XLF Elliott Wave Analysis Projects Wave 3 Breakout with Key Support and Bullish ETF Trading Opportunity

SPDR Select Sector Fund ETF – XLF Elliott Wave Analysis Daily Chart

SPDR Select Sector Fund ETF – XLF Daily Chart Analysis

XLF Elliott Wave Technical Analysis

Function: Major Trend

Mode: Motive

Structure: Impulse Wave

Position: Wave 3

Direction: Uptrend

Details:

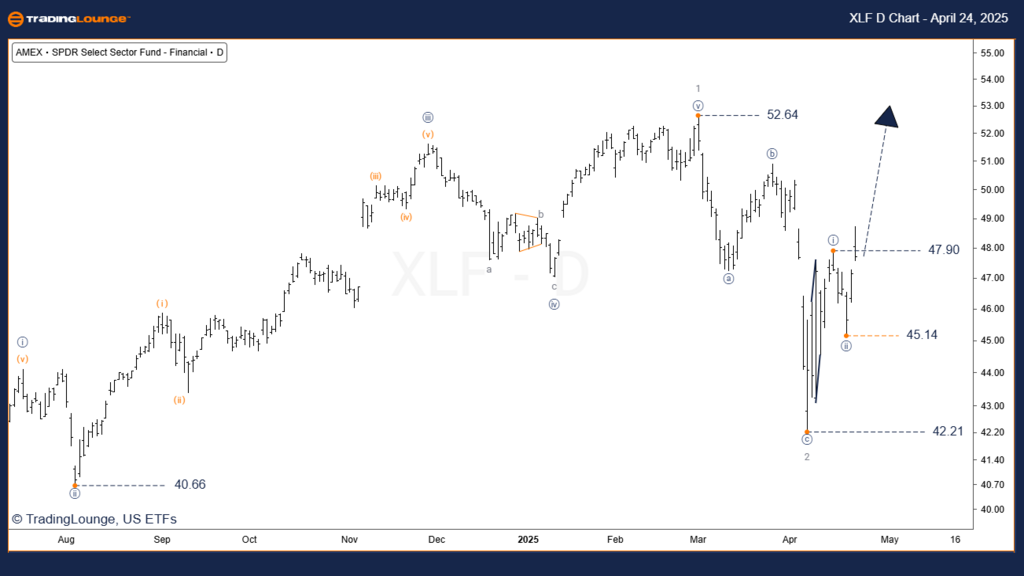
  • Wave 3 is currently in motion, suggesting continued bullish momentum and the potential to break above previous highs.
  • This phase is typically the most powerful segment within the five-wave impulse pattern.
  • The rally is expected to surpass the prior key resistance at $52.64.

However, caution is warranted as this movement may still be part of a corrective sequence—potentially wave [b] of 2 yet to fully complete.

Key support holds at $45.14, which acts as a pivot for the bullish scenario.

Invalidation for the wave count is set at $42.21.

XLF-Day-ETF-Chart-24...


SPDR Select Sector Fund ETF – XLF Elliott Wave Analysis – 4-Hour Chart

Function: Major Trend

Mode: Motive

Structure: Impulse

Position: Wave (iii) orange

Direction: Uptrend

Details:

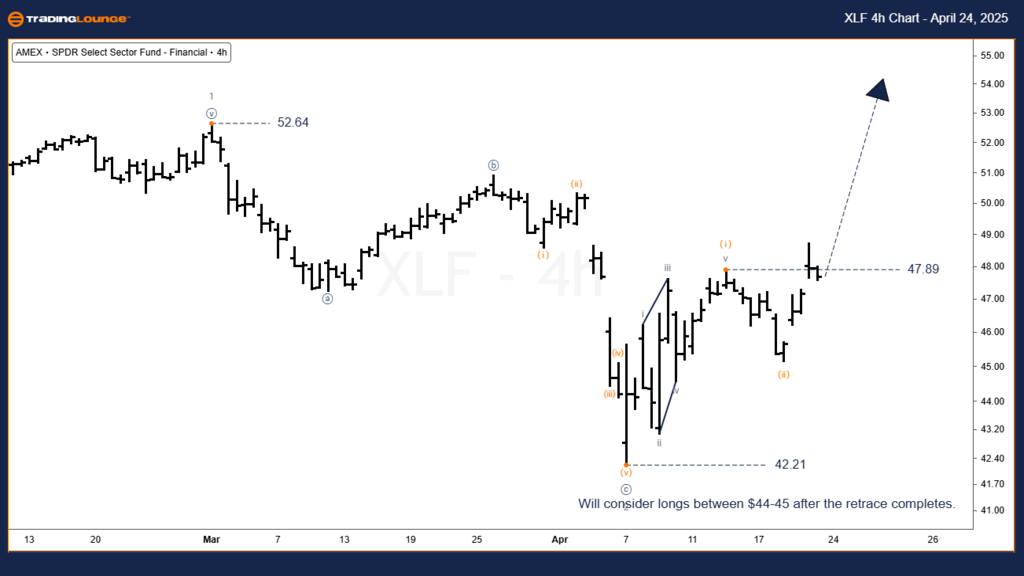
Wave (ii) seems to have completed, although a flat correction is still possible.

Support is clearly defined by the low of wave (ii) and the wave [c] of 2 low.

A breakout above $47.89 offers the first bullish confirmation, though more is needed to validate wave (iii).

Wave (iii) is projected to reach and likely exceed $51.00, in line with standard third-wave behavior.

Key support remains firm at $45.14.

Invalidation level is set at $42.21.

Technical Analyst: Simon Brooks

Source: Visit Tradinglounge.com and learn from the Experts. Join TradingLounge Here 

See Previous: Grayscale Ethereum Trust ETF – ETHE Elliott Wave Technical Analysis

VALUE Offer - Buy 1 Month & Get 3 Months!Click here

Access 7 Analysts Over 200 Markets Covered. Chat Room With Support

XLF-4h-ETF-Chart-240...


Conclusion:

XLF’s upward trajectory is likely part of wave (iii) within a developing wave [i] of wave 3, indicating a strong bullish setup for ETF traders. The next leg higher should exceed the $52.64 mark, with $51.00 as a primary target for wave (iii). Traders should adhere closely to Elliott Wave guidelines and watch invalidation levels to maintain disciplined entries and exits in this bullish scenario.

Related

Berkshire Hathaway Inc.(BRK.B:NYSE) Elliott Wave Technical Analysis 22 November 23

Berkshire Hathaway Inc.(BRK.B:NYSE) Elliott Wave Technical Analysis 22 November 23

Stock Berkshire Hathaway Inc.(BRK.B: NYSE) Elliott Wave Technical Analysis 1-hour and 4-hour Chart d...

Read More >
Navigating Markets: Weekly Forex, Crypto, Stocks Insights & Trade Opportunities (5th-9th February 2024)

Navigating Markets: Weekly Forex, Crypto, Stocks Insights & Trade Opportunities (5th-9th February 2024)

Explore our Weekly Elliott Wave Analysis Report (5th-9th February 2024) for expert insights and trad...

Read More >
Bovespa Index Elliott Wave Analysis Reveals Brazil Stock Market Forecast With Bullish Trend, and Strategic Trading Opportunities

Bovespa Index Elliott Wave Analysis Reveals Brazil Stock Market Forecast With Bullish Trend, and Strategic Trading Opportunities

Elliott Wave analysis of the Bovespa Index with both daily and weekly chart interpretations. It outl...

Read More >
CAC 40 (France) Elliott Wave Analysis: Bullish Trend, Trading Strategy, Price Movement, Wave Structure & Key Support Levels

CAC 40 (France) Elliott Wave Analysis: Bullish Trend, Trading Strategy, Price Movement, Wave Structure & Key Support Levels

CAC 40 Elliott Wave Analysis provides a detailed technical breakdown of the French stock market inde...

Read More >
Watch CAT Stock Progresses through its Current Market Structure Using Caterpillar Inc. (CAT) Elliott Wave Technical Analysis

Watch CAT Stock Progresses through its Current Market Structure Using Caterpillar Inc. (CAT) Elliott Wave Technical Analysis

This article provides a comprehensive Elliott Wave analysis of Caterpillar Inc. (CAT), examining bot...

Read More >
Comprehensive Elliott Wave Technical Forecast:  Analog Devices Inc. (ADI) Stocks

Comprehensive Elliott Wave Technical Forecast: Analog Devices Inc. (ADI) Stocks

Dive into our detailed Elliott Wave analysis of Analog Devices Inc. (ADI) as of June 2024. This repo...

Read More >

$1 for 2 Weeks

then $29 a month!

What a Special Offer!

Trade Recommendations

Unleash the power of deversified trading with our comprehensive portfolio, covering 250+ markets:

  • Stock Trades
  • Crypto Trades
  • Forex Trades
  • Commodity Trades
Elliott Wave Analysis

Gain a competitive edge with expert insights and AI-powered Elliott Wave charting into:

  • Global Indices
  • US Stocks & ASX Stocks
  • Forex & Crypto
  • Commodities
Top-Notch Trading Tools

Equip yourself with the tools of success:

  • Real-time Chat rooms
  • Elliott Wave Algorithm
  • Portfolio tools
  • TradingLevels
  • Screener
  • Trading Game
7 Elliott Wave Analysts

Stay ahead of the market with daily charts and insightful videos
Your secret to strategic trading!

JOIN HERE


Welcome to TradingLounge (ASIC A.R.No. 321187), specialists in trades, trading education and technical analysis, covering stocks, indices, commodities, forex and cryptocurrencies.

When you join TradingLounge you have access to everything we offer, including trade tools, educational content and a social platform to chat with like-minded investors.

Read more

@Copyright 2024 by tradinglounge.com

Contact Us

Australian no: 02 4787 6020

International no: +61 (2) 47876020

Pay with:

Find us on