In the world of corn market analysis, understanding Elliott Wave patterns can unlock significant insights into future price movements. Let's delve into the current scenario:
Corn Market Analysis: Riding the Waves
Corn Elliott Wave technical analysis
Function - Trend
Mode - Counter-Trend
Structure - Expecting Impulse Wave
Position - Wave 2
Direction - Wave 3
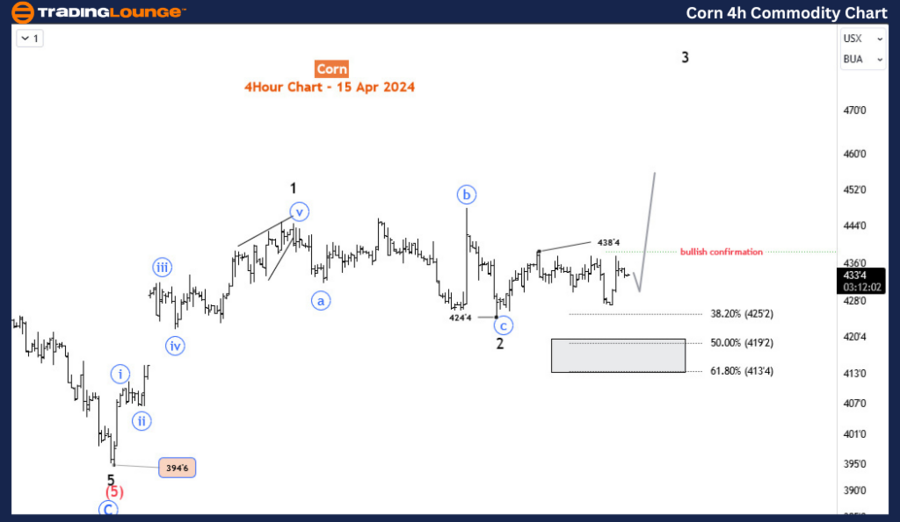
Details - Wave 2 may not drop inside the 419-413 support zone where we expected it to end. Perhaps it has been completed with the surge to 438’4 and the subsequent corrective response. Wave 3 is probably in play and will be confirmed by the breach above 438’4. However, a double three corrective pattern into the zone is still likely. So we need an important impulse break upwards to confirm wave 2 has ended.
Market Movement Insights
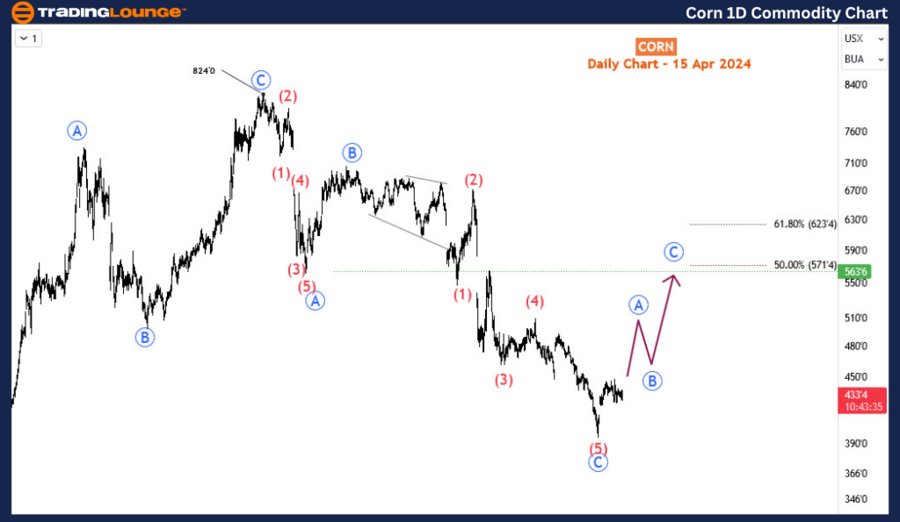
Between 26 February and 13 March 2024, Corn gained over 12%. However, that’s merely a 17% recovery of the April 2022-to-February 2024 sell-off. Thus, there is still some way upside to go. From the Elliott wave perspective, it seems the current recovery will extend higher into the 22-month sell-off. By projection, the price might correct up to 571-623 Fibonacci retracement area. Today’s commodity blog post intends to show traders how to gain from this bullish corrective cycle.
Corn Commodity Day Chart Analysis
On the daily chart, from 824, we identified a corrective decline from April 2022 down to 394 in February 2024. Ideally, an impulse wave should follow to break above 824 in the long term. However, in this case, we will consider a 3-wave corrective bounce at first, and if the price supports, an impulse later. Currently, the price is in blue wave ‘A’ of blue wave ’1’ (both circled). We expect either to start with an impulse wave. On the H4 time frame, we can see the sub-waves of the current bounce better.
TradingLounge Commodities Elliott Wave Analysis of Corn
Corn 4-Hour Chart Analysis
On the H4 chart, a rally from 394 has completed the first impulse - wave 1. This is an indication that we may be right with the expected strong corrective rally or a long-term bullish impulse. From the end of wave 1, wave 2 has emerged and is quite debatable in the way it’s being structured. We expected wave 2 to end in the 419-413 key support zone. However, it appears wave 2 has ended with an expanding flat pattern. Flats can be quite tricky and can quickly transform a different pattern. Two ways to confirm wave 3 has started:
1. price breaks above blue wave ‘b’ of 2 high and
2. an impulsive break above 438
If the price confirms the end of wave 2, we should see wave 3 between 492 and 515 or maybe even higher. Thus, there’s more room to the upside for buyers to explore. However, if wave 3 is not confirmed, a further dip into the 419-423 or even lower shouldn’t come as a surprise.
Conclusion: Navigating the Corn Market Landscape
In summary, Elliott Wave analysis provides invaluable insights into the corn market's trajectory, highlighting potential bullish trends and corrective patterns. Traders equipped with a comprehensive understanding of these dynamics stand to capitalize on emerging opportunities, strategically positioning themselves for success in this dynamic market environment. Stay tuned for further updates as we navigate the evolving landscape of the corn market.
Technical Analyst: Sanmi Adeagbo
Source: visit Tradinglounge.com and learn From the Experts Join TradingLounge Here
See Previous: Wheat Commodity
TradingLounge Once Off SPECIAL DEAL: Here > 1 month Get 3 months.
TradingLounge's Free Week Extravaganza!
April 14 – 21: Unlock the Doors to Trading Excellence — Absolutely FREE