29Aug

Reliance Industries' Stock Performance and Reliance Elliott Wave Technical Analysis includes Key Insights into the Current Trends

RELIANCE INDUSTRIES – RELIANCE (1D Chart) Elliott Wave Analysis

RELIANCE INDUSTRIES – RELIANCE 1Day Chart Analysis

RELIANCE Elliott Wave Technical Analysis

  • Function: Corrective Lower (Intermediate degree, orange)

  • Mode: Corrective

  • Structure: Zigzag

  • Position: Minute Wave ((ii)) Grey

  • Details: Minute Wave ((ii)) Grey may be complete near 3050, with Minute Wave ((iii)) expected to move lower against 3220

  • Invalidation Point: 3220

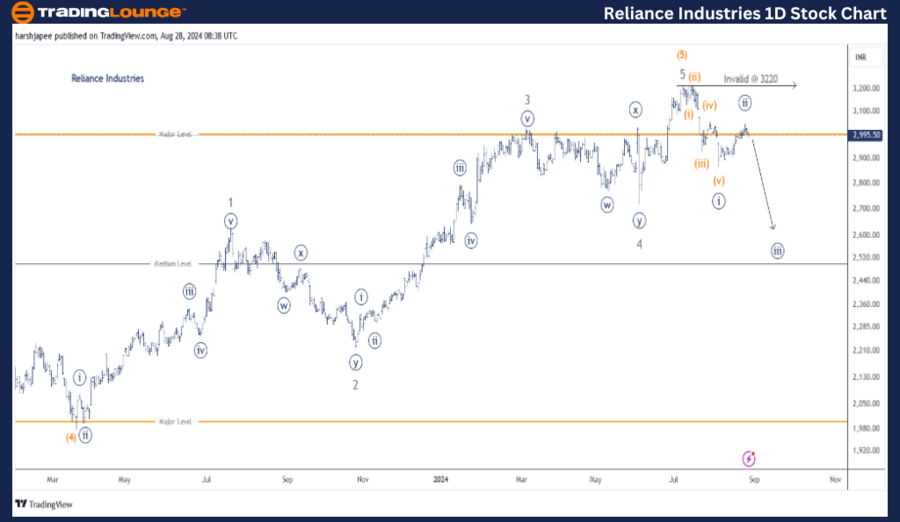
Reliance Industries Daily Chart Technical Analysis and Potential Elliott Wave Counts:

The daily chart of Reliance Industries indicates a significant top at 3220, established in July 2024. Minute Wave ((v)) of Minor Wave 5 Grey within Intermediate Wave (5) Orange appears complete, signaling the potential for a deeper correction ahead.

The stock has trended upward since the March 2023 lows around the 1980-90 levels, identified as Intermediate Wave (4). The five-wave subdivision looks complete at 3220, marking the end of the fifth wave across multiple degrees.

Furthermore, the stock has started moving lower from the 3220 high, forming Minute Waves ((i)) and ((ii)) Navy. If this bearish structure holds, the stock may experience a sharp decline, provided prices remain below the 3220 mark.

Reliance-Industries-...


RELIANCE INDUSTRIES – RELIANCE (4H Chart) Elliott Wave Analysis

RELIANCE INDUSTRIES – RELIANCE Stock Technical Analysis

  • Function: Corrective Lower (Intermediate degree, orange)

  • Mode: Corrective

  • Structure: Impulse within a larger degree Zigzag

  • Position: Minute Wave ((ii)) Grey

  • Details: Minute Wave ((ii)) Grey could be complete around 3050, with Minute Wave ((iii)) moving lower against 3220

  • Invalidation Point: 3220

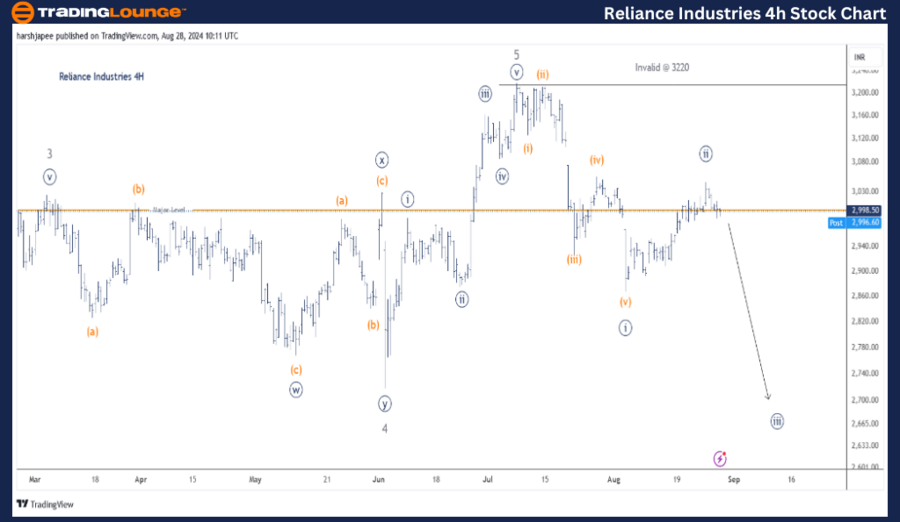
Reliance Industries 4H Chart Technical Analysis and Potential Elliott Wave Counts:

The 4H chart of Reliance Industries reveals the sub-waves following the completion of Minor Wave 4 Grey around 2720 on June 04, 2024. The stock is subdivided into five waves at the minute degree, culminating at 3220. It closed the day at 2998, showing continued downward pressure.

Lower degree Waves ((i)) and ((ii)) seem complete around 2870 and 3050 levels, respectively. Additionally, the 2850 level is near the previous wave (iv) of one lesser degree. If this analysis is correct, the decline should accelerate moving forward.

Technical Analyst: Harsh Japee

Source: visit Tradinglounge.com and learn From the Experts Join TradingLounge Here 

Previous: GRASIM Elliott Wave Technical Analysis 

Special Trial Offer - 0.76 Cents a Day for 3 Months! Click here

Access 7 Analysts Over 200 Markets Covered. Chat Room With Support

Reliance-Industries-...


Conclusion:

Reliance Industries is currently trending lower within Minute Wave ((iii)) Navy, targeting a decline against the 3220 level. It’s notable that the stock closed in negative territory, despite the Nifty 50 Index reaching an all-time high earlier in the day.

Related

Apply Technical Indicators to Predict Bitcoin's next move: Bitcoin Crypto Price News and BTCUSD Elliott Wave Technical Analysis

Apply Technical Indicators to Predict Bitcoin's next move: Bitcoin Crypto Price News and BTCUSD Elliott Wave Technical Analysis

This article provides a comprehensive Bitcoin price analysis based on the Elliott Wave theory. It co...

Read More >
NIFTY 50 Elliott Wave Technical Analysis: Expanded Flat Correction Nears 25,000-25,100, Key Support at 22,700

NIFTY 50 Elliott Wave Technical Analysis: Expanded Flat Correction Nears 25,000-25,100, Key Support at 22,700

The NIFTY 50 Index is currently in a corrective wave phase, moving towards 25,000-25,100 as part of ...

Read More >
Binance Crypto Price News Today Elliott Wave Technical Analysis: Mastering BNBUSD Trading Dynamics

Binance Crypto Price News Today Elliott Wave Technical Analysis: Mastering BNBUSD Trading Dynamics

This article provides a comprehensive Elliott Wave analysis of the Binance/US Dollar (BNBUSD) tradin...

Read More >
Bitcoin Elliott Wave Analysis: BTC/USD Price Forecast, Support & Resistance Levels, and Key Market Trends for Traders

Bitcoin Elliott Wave Analysis: BTC/USD Price Forecast, Support & Resistance Levels, and Key Market Trends for Traders

This Elliott Wave analysis of BTC/USD provides insights into Bitcoin’s current trend, price targets...

Read More >
Costco Wholesale Corp.(COST) Stocks Elliott Wave Technical Analysis: Focusing on both daily and 4-hour charts

Costco Wholesale Corp.(COST) Stocks Elliott Wave Technical Analysis: Focusing on both daily and 4-hour charts

This article provides a detailed Elliott Wave analysis of Costco Wholesale Corp. (COST) focusing on ...

Read More >
AMZN stock analysis: Comprehensive Amazon Inc.(AMZN) Elliott Wave Technical Analysis and Forecast

AMZN stock analysis: Comprehensive Amazon Inc.(AMZN) Elliott Wave Technical Analysis and Forecast

Gain valuable insights into Amazon's stock (AMZN) with in-depth analysis covering Elliott Wave p...

Read More >

$1 for 2 Weeks

then $29 a month!

What a Special Offer!

Trade Recommendations

Unleash the power of deversified trading with our comprehensive portfolio, covering 250+ markets:

  • Stock Trades
  • Crypto Trades
  • Forex Trades
  • Commodity Trades
Elliott Wave Analysis

Gain a competitive edge with expert insights and AI-powered Elliott Wave charting into:

  • Global Indices
  • US Stocks & ASX Stocks
  • Forex & Crypto
  • Commodities
Top-Notch Trading Tools

Equip yourself with the tools of success:

  • Real-time Chat rooms
  • Elliott Wave Algorithm
  • Portfolio tools
  • TradingLevels
  • Screener
  • Trading Game
7 Elliott Wave Analysts

Stay ahead of the market with daily charts and insightful videos
Your secret to strategic trading!

JOIN HERE


Welcome to TradingLounge (ASIC A.R.No. 321187), specialists in trades, trading education and technical analysis, covering stocks, indices, commodities, forex and cryptocurrencies.

When you join TradingLounge you have access to everything we offer, including trade tools, educational content and a social platform to chat with like-minded investors.

Read more

@Copyright 2024 by tradinglounge.com

Contact Us

Australian no: 02 4787 6020

International no: +61 (2) 47876020

Pay with:

Find us on