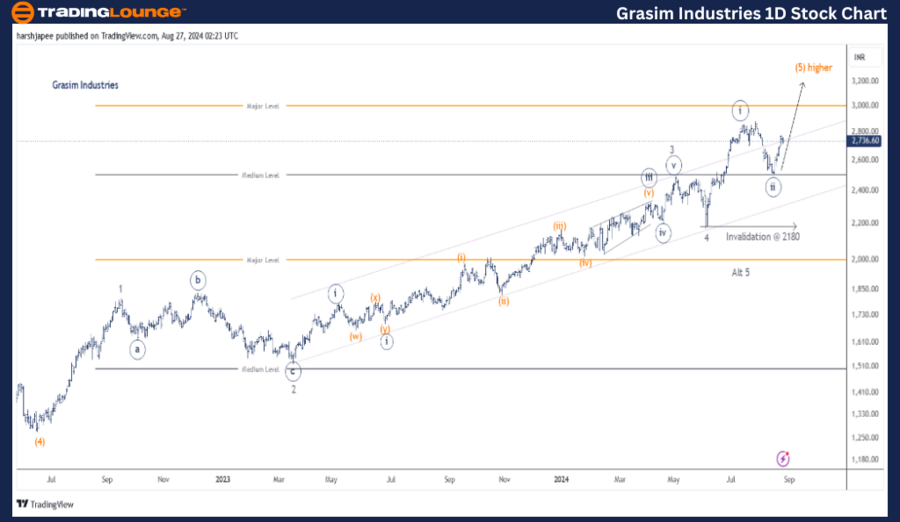
GRASIM INDUSTRIES – GRASIM (1D Chart) Elliott Wave / Technical Analysis

GRASIM INDUSTRIES Elliott Wave Technical Analysis

Function: Larger Degree Trend Higher (Intermediate Degree, Orange, Wave (5))

Mode: Motive

Structure: Impulse

Position: Minute Wave ((ii)) Navy

Details: Minute Wave ((iii)) Navy of Minor Wave 5 Grey is advancing within Intermediate Wave (5) Orange, targeting levels above 2180. Alternatively, Wave (5) Orange may have completed above 2900.

Invalidation Point: 2180

Grasim Industries Daily Chart Technical Analysis and Potential Elliott Wave Counts

Grasim Industries' daily chart suggests a continuation of the larger uptrend, with Minor Wave 5 Grey unfolding as an impulse wave against the 2180 mark. Minute Wave ((iii)) is expected to resume upward momentum following the bottoming of Wave ((ii)) near the 2500 level.

Intermediate Wave (4) concluded around the 1270 mark in June 2022. Since then, Minor Waves 1, 3, and 4 appear complete, with prices now advancing within Minor Wave 5 Grey, aiming to terminate Intermediate Wave (5).

Alternatively, Minor Wave 5 might have already completed around the 2900 mark, indicating a potential bearish scenario with a break below 2180 confirming this outlook. Immediate support is observed around the 2500 level.

Grasim-Industries-1d...


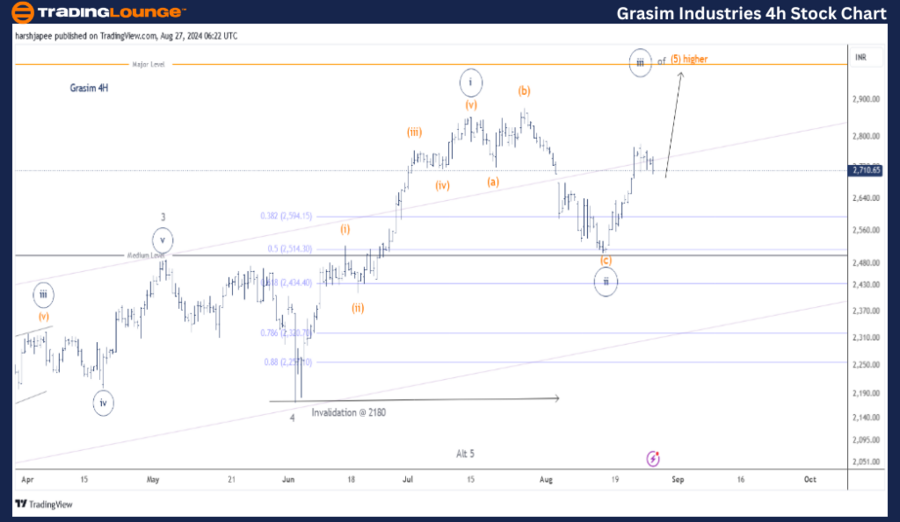
GRASIM INDUSTRIES – GRASIM (4H Chart) Elliott Wave / Technical Analysis

Function: Larger Degree Trend Higher (Intermediate Degree, Orange, Wave (5))

Mode: Motive

Structure: Impulse

Position: Minute Wave ((ii)) Navy

Details: Minute Wave ((iii)) Navy of Minor Wave 5 Grey is advancing within Minor Wave 5 Grey of Intermediate Wave (5) Orange, targeting levels above 2180. Alternatively, Wave (5) Orange may have completed above 2900.

Invalidation Point: 2180

Grasim Industries 4H Chart Technical Analysis and Potential Elliott Wave Counts

The 4H chart for Grasim Industries reveals sub-waves following the termination of Minor Wave 4 around the 2180 mark. The stock is progressing within Minute Wave ((iii)) against the 2500 mark in the near term. Notably, Minute Wave ((ii)) concluded around the Fibonacci 0.50 level of Wave ((i)).

Further analysis of the sub-waves suggests that Minute Wave ((i)) formed an impulse between the 2180 and 2860 levels. Minute Wave ((ii)), potentially an expanded flat, seems to have terminated near the 2500 level. If this scenario holds, Grasim Industries should continue its upward trajectory with prices staying above 2500 broadly.

Conclusion:

Grasim Industries is advancing within Minute Wave ((iii)) of Minor Wave 5 Grey, positioned within Intermediate Wave (5), targeting levels above 2180.

Technical Analyst: Harsh Japee

Source: visit Tradinglounge.com and learn From the Experts Join TradingLounge Here 

Previous: ADANIPORTS Elliott Wave Technical Analysis 

Special Trial Offer - 0.76 Cents a Day for 3 Months! Click here

Access 7 Analysts Over 200 Markets Covered. Chat Room With Support

Grasim-Industries-4h...

Related

USDJPY Elliott Wave Technical Analysis: U.S. Dollar / Japanese Yen Forex Pair Bearish Trend & Forecast for Traders

USDJPY Elliott Wave Technical Analysis: U.S. Dollar / Japanese Yen Forex Pair Bearish Trend & Forecast for Traders

This USDJPY Elliott Wave Analysis provides an in-depth look at the bearish trend, price action, and ...

Read More >
British Pound/ U.S. Dollar (GBPUSD) Elliott Wave Analysis: Bullish Wave 3 Progression with Key Invalidation Level at 1.31425

British Pound/ U.S. Dollar (GBPUSD) Elliott Wave Analysis: Bullish Wave 3 Progression with Key Invalidation Level at 1.31425

The GBPUSD pair is exhibiting a bullish trend, currently in Wave 3 according to Elliott Wave analysi...

Read More >
Euro/British Pound(EURGBP) Elliott Wave Technical Analysis 1 November 23

Euro/British Pound(EURGBP) Elliott Wave Technical Analysis 1 November 23

The "EURGBP Elliott Wave Analysis Trading Lounge Day Chart" dated 1 November 23, offers an...

Read More >
Texas Instruments (TXN) Elliott Wave Analysis: Stock Forecast, Price Prediction, Bullish Trend, and Trading Strategy for Smart Investors

Texas Instruments (TXN) Elliott Wave Analysis: Stock Forecast, Price Prediction, Bullish Trend, and Trading Strategy for Smart Investors

Texas Instruments (TXN) Elliott Wave analysis with insights into its bullish trend, price forecast, ...

Read More >
Euro/U.S.Dollar(EURUSD) 4 Hour Chart Elliott Wave Technical Analysis 10 January 24

Euro/U.S.Dollar(EURUSD) 4 Hour Chart Elliott Wave Technical Analysis 10 January 24

EURUSD Elliott Wave Analysis dated 10 January 24, provides a comprehensive examination of the Euro/U...

Read More >
Solana Price Prediction and SOLUSD Elliott Wave Analysis Reveals Short-Term Strategy Ahead of Wave C Correction – April 2025 Forecast

Solana Price Prediction and SOLUSD Elliott Wave Analysis Reveals Short-Term Strategy Ahead of Wave C Correction – April 2025 Forecast

This analysis covers Solana’s corrective Wave B formation and potential decline into Wave C, suppor...

Read More >

$1 for 2 Weeks

then $29 a month!

What a Special Offer!

Trade Recommendations

Unleash the power of deversified trading with our comprehensive portfolio, covering 250+ markets:

  • Stock Trades
  • Crypto Trades
  • Forex Trades
  • Commodity Trades
Elliott Wave Analysis

Gain a competitive edge with expert insights and AI-powered Elliott Wave charting into:

  • Global Indices
  • US Stocks & ASX Stocks
  • Forex & Crypto
  • Commodities
Top-Notch Trading Tools

Equip yourself with the tools of success:

  • Real-time Chat rooms
  • Elliott Wave Algorithm
  • Portfolio tools
  • TradingLevels
  • Screener
  • Trading Game
7 Elliott Wave Analysts

Stay ahead of the market with daily charts and insightful videos
Your secret to strategic trading!

JOIN HERE


Welcome to TradingLounge (ASIC A.R.No. 321187), specialists in trades, trading education and technical analysis, covering stocks, indices, commodities, forex and cryptocurrencies.

When you join TradingLounge you have access to everything we offer, including trade tools, educational content and a social platform to chat with like-minded investors.

Read more

@Copyright 2024 by tradinglounge.com

Contact Us

Australian no: 02 4787 6020

International no: +61 (2) 47876020

Pay with:

Find us on