ADANI PORTS and SEZ – ADANIPORTS (1D Chart) Elliott Wave Analysis:

ADANIPORTS Daily Chart Technical Analysis

ADANIPORTS Elliott Wave Technical Analysis

Function: Counter Trend (Intermediate degree, orange)

Mode: Corrective

Structure: Beginning to unfold

Position: Lower against 1620. Wave ((5)) Orange.

Details: The larger degree impulse Wave ((5)) appears to be complete. The stock is likely correcting lower from the 1620 high. The structure is still unfolding and could be developing into an impulse. Additionally, potential lower degree waves ((i)) and ((ii)) may also be complete. No change from last week.

Invalidation point: 1620-30

Adani Ports and SEZ Daily Chart Technical Analysis and Potential Elliott Wave Counts

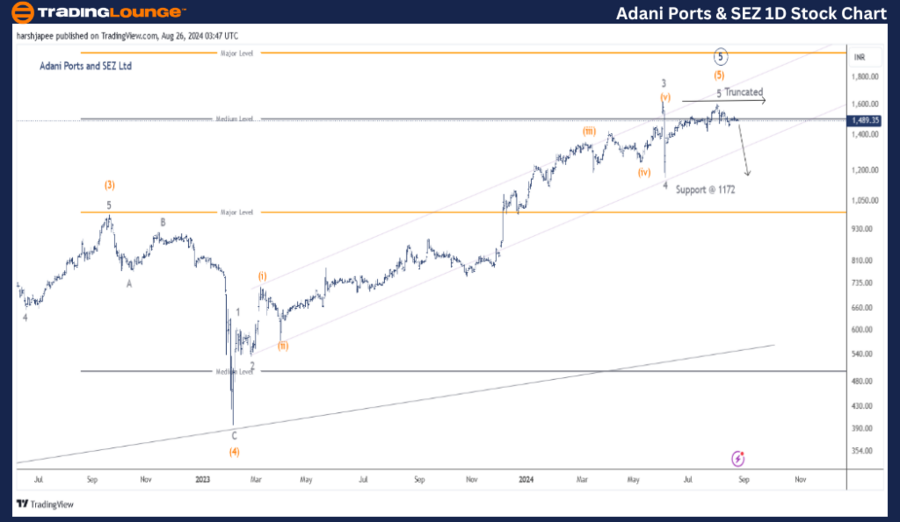
The daily chart of Adani Ports and SEZ suggests that Intermediate Wave (5) Orange is complete around the 1610-20 zone. The wave seems truncated, peaking just below the orthodox high of Minor Wave 3. If this scenario is accurate, the next larger degree wave is expected to move lower against the 1610-20 range.

Adani Ports and SEZ has been unfolding its Primary Wave ((5)) after bottoming out around the 200-10 lows in March 2020. Additionally, its Intermediate Wave (5) Orange has been unfolding since March 2023, starting from the 400 lows. The all-time high, registered near the 1610-20 range, likely marks the completion of the fifth wave at multiple degrees.

If this analysis holds true, the stock should be setting up for a larger degree corrective wave against the 1610-20 range. A break below 1160-70, corresponding to Minor Wave 4, would confirm this outlook and strengthen the bearish scenario.

Adani-Ports-and-SEZ-...


ADANI PORTS and SEZ – ADANIPORTS (4-Hour Chart) Elliott Wave Analysis:

Adani Ports and SEZ 4H Chart Technical Analysis and Potential Elliott Wave Counts

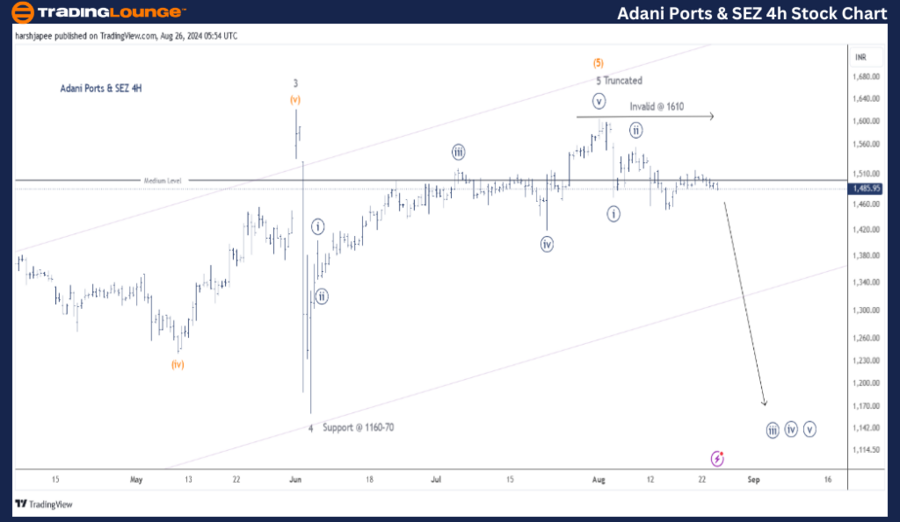
The 4H chart of Adani Ports and SEZ highlights potential wave counts between the 1160-70 and 1610-20 levels. Notably, Minor Wave 5 Grey could be subdivided into a potential impulse, which terminated at 1607, marked as Truncated.

Ideally, prices should remain below Minor Wave 5 (1607) and continue moving lower. Additionally, Minute Waves ((i)) and ((ii)) Navy appear complete, and the stock is now potentially progressing within Wave ((iii)) against the 1560 mark.

If this structure holds, the stock could experience a sharp decline as Minuette waves begin to unfold from current levels around 1488. Only a break above 1610 would broadly invalidate the bearish outlook.

Technical Analyst: Harsh Japee

Source: visit Tradinglounge.com and learn From the Experts Join TradingLounge Here 

Previous: Nifty 50 index Elliott Wave Technical Analysis

Special Trial Offer - 0.76 Cents a Day for 3 Months! Click here

Access 7 Analysts Over 200 Markets Covered. Chat Room With Support

Adani-Ports-and-SEZ-...

Conclusion:

Adani Ports and SEZ could be unfolding an extended Minute Wave ((iii)) Navy against the 1610-20 highs. The medium-term target could be around the 1160-70 range.

Related

CAR Group Limited ASX:CAR Elliott Wave Analysis Signals Bullish Breakout, Wave (5) Targets 41.30, Strong Support at 28.40

CAR Group Limited ASX:CAR Elliott Wave Analysis Signals Bullish Breakout, Wave (5) Targets 41.30, Strong Support at 28.40

ASX: CAR may have completed a corrective wave and is now forming a bullish trend. Wave (5) is unfold...

Read More >
Achieving ASX Trading Success: AMCOR PLC (AMC) Stock Insights and Elliott Wave Technical Analysis

Achieving ASX Trading Success: AMCOR PLC (AMC) Stock Insights and Elliott Wave Technical Analysis

Get an in-depth analysis of AMCOR PLC (AMC) with Elliott Wave insights, ASX stock forecasts, and tra...

Read More >
Newmont Corporation (ASX:NEM) Elliott Wave Analysis Reveals Bullish Wave 3 Progression with $100 Target and Key Price Levels

Newmont Corporation (ASX:NEM) Elliott Wave Analysis Reveals Bullish Wave 3 Progression with $100 Target and Key Price Levels

This analysis provides an in-depth Elliott Wave forecast for Newmont Corporation (ASX:NEM), highligh...

Read More >
URA Elliott Wave Analysis: Detailed Uranium ETF Forecast, Market Trends, and Long-Term Buying Opportunities in the Uranium Sector

URA Elliott Wave Analysis: Detailed Uranium ETF Forecast, Market Trends, and Long-Term Buying Opportunities in the Uranium Sector

This URA Elliott Wave analysis provides an in-depth look at the Global X Uranium ETF (URA) and its t...

Read More >
British Pound/U.S. Dollar(GBPUSD) Elliott Wave Technical Analysis 30 January 24

British Pound/U.S. Dollar(GBPUSD) Elliott Wave Technical Analysis 30 January 24

Trading Lounge Day and 4H Chart for GBPUSD Elliott Wave Analysis dated 30 January 24, provides a det...

Read More >
Promising trends according to Ethereum/ U.S. dollar(ETHUSD) Elliott Wave Technical Analysis

Promising trends according to Ethereum/ U.S. dollar(ETHUSD) Elliott Wave Technical Analysis

Ethereum's performance against the U.S. dollar (ETHUSD) is analyzed through Elliott Wave analysi...

Read More >

$1 for 2 Weeks

then $29 a month!

What a Special Offer!

Trade Recommendations

Unleash the power of deversified trading with our comprehensive portfolio, covering 250+ markets:

  • Stock Trades
  • Crypto Trades
  • Forex Trades
  • Commodity Trades
Elliott Wave Analysis

Gain a competitive edge with expert insights and AI-powered Elliott Wave charting into:

  • Global Indices
  • US Stocks & ASX Stocks
  • Forex & Crypto
  • Commodities
Top-Notch Trading Tools

Equip yourself with the tools of success:

  • Real-time Chat rooms
  • Elliott Wave Algorithm
  • Portfolio tools
  • TradingLevels
  • Screener
  • Trading Game
7 Elliott Wave Analysts

Stay ahead of the market with daily charts and insightful videos
Your secret to strategic trading!

JOIN HERE


Welcome to TradingLounge (ASIC A.R.No. 321187), specialists in trades, trading education and technical analysis, covering stocks, indices, commodities, forex and cryptocurrencies.

When you join TradingLounge you have access to everything we offer, including trade tools, educational content and a social platform to chat with like-minded investors.

Read more

@Copyright 2024 by tradinglounge.com

Contact Us

Australian no: 02 4787 6020

International no: +61 (2) 47876020

Pay with:

Find us on