Elliott Wave Analysis for NEO/USD: Comprehensive Daily and 4-Hour Chart Insights
In the dynamic world of cryptocurrency trading, Elliott Wave Analysis offers invaluable insights into market trends and potential price movements. Our detailed examination of the NEO/USD pair reveals a strong adherence to the Elliott Wave principles, presenting a promising outlook for traders.
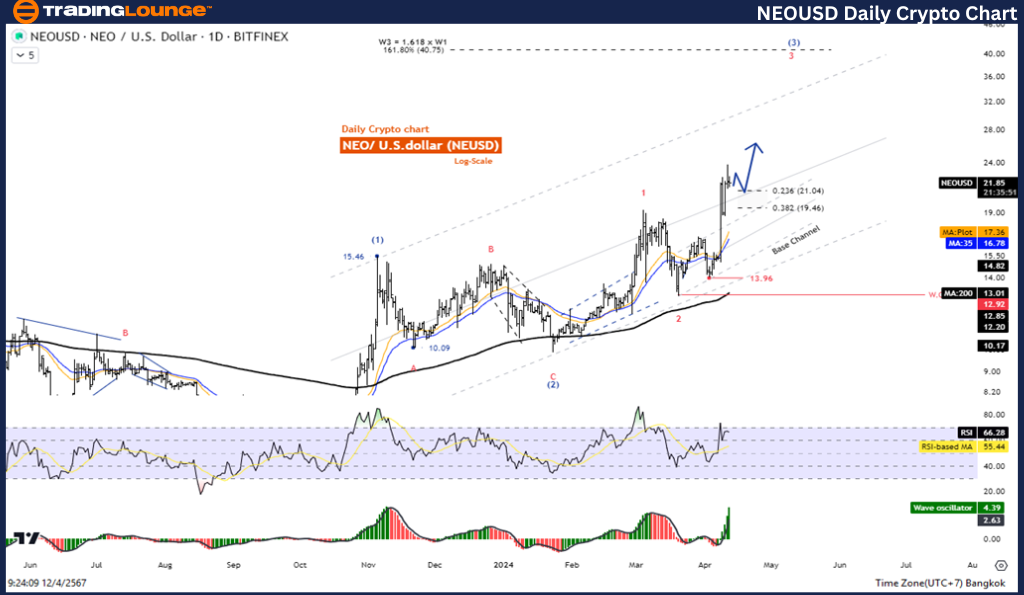
NEO / U.S. dollar(NEOUSD) Daily Chart Analysis
NEOUSD Elliott Wave Technical Analysis
Function: Follow Trend
Mode: Motive
Structure: Impulse
Position: Wave (3)
Direction Next higher Degrees: Wave ((3)) of Impulse
Wave Cancel invalid Level: 9.85
Details: Wave (3) is Equal to 161.8% of Wave (1) at 24.52
NEO / U.S. dollar(NEOUSD)Trading Strategy:
NEO is still in an uptrend in the form of an Impulse Wave and the price has a chance to test the 19.45 level before correcting again. Therefore, the overall picture is still a continuous increase. Look for opportunities to open long positions.
Technical Indicator Highlights
- The NEO/USD price trajectory remains firmly above the MA200, signifying a bullish market environment.
- The Wave Oscillator's bullish momentum further supports the optimistic outlook for NEO/USD.
Elliott Wave Analysis on a Shorter Timeframe
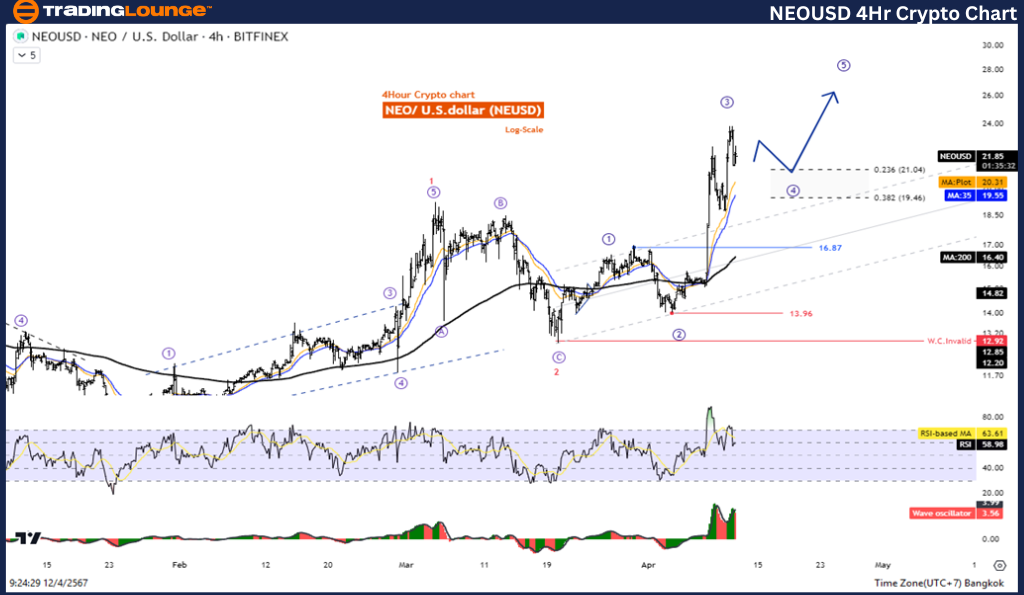
The 4-hour chart echoes the daily analysis, reinforcing the bullish sentiment and providing traders with additional granularity for decision-making.
NEO / U.S. dollar(NEOUSD) 4-hour chart analysis
NEOUSD Elliott Wave Technical Analysis
Function: Follow Trend
Mode: Motive
Structure: Impulse
Position: Wave (3)
Direction Next higher Degrees: Wave ((3)) of Impulse
Wave Cancel invalid Level: 9.85
Details: Wave (3) is Equal to 161.8% of Wave (1) at 24.52
NEO / U.S. dollar(NEOUSD)Trading Strategy:
NEO is still in an uptrend in the form of an Impulse Wave and the price has a chance to test the 19.45 level before correcting again. Therefore, the overall picture is still a continuous increase. Look for opportunities to open long positions.
NEOUSD Technical Indicators and Market Sentiment
- The price's position above the MA200 in the 4-hour chart consolidates the bullish market outlook.
- The bullish momentum, as indicated by the Wave Oscillator, further validates the positive sentiment surrounding NEO/USD.
Conclusion: Navigating the NEO/USD Market with Elliott Wave Analysis
Our comprehensive Elliott Wave Analysis of NEO/USD across daily and 4-hour charts underscores a robust and sustained uptrend, marked by key Impulse movements and bullish technical indicators. Traders are encouraged to leverage this analysis for strategic positioning, with a focus on long positions to capitalize on the anticipated upward trajectory. As always, it's crucial to remain vigilant and consider the invalidation level as a critical parameter for risk management.
Technical Analyst: Kittiampon Somboonsod
Source: visit Tradinglounge.com and learn From the Experts Join TradingLounge Here
See Previous: BNBUSD Elliott Wave Technical Analysis
TradingLounge Once Off SPECIAL DEAL: Here > 1 month Get 3 months.
TradingLounge's Free Week Extravaganza!
April 14 – 21: Unlock the Doors to Trading Excellence — Absolutely FREE