Exxon Mobil Corp., Elliott Wave Technical Analysis
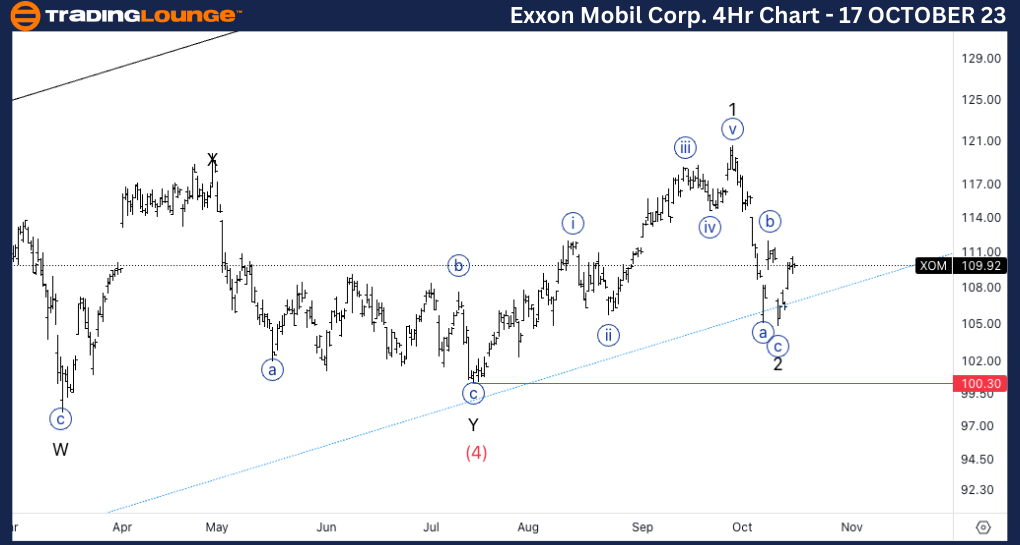
Exxon Mobil Corp., (XOM:NYSE): 4H Chart, 17 October 23
XOM Stock Market Analysis: We were anticipating downside last week as we identified a potential top in wave 1. Not only we pull backed lower, but we seem to have had a three wave move into wave 2 which provides us with additional confluence to our upside target.
XOM Elliott Wave Count: Wave {i} of 3.
XOM Technical Indicators: Crossing of 20 and 200EMA.
XOM Trading Strategy: Looking for a clear five wave move into wave {i} to then look for longs.
TradingLounge Analyst: Alessio Barretta
Source: Tradinglounge.com get trial here!
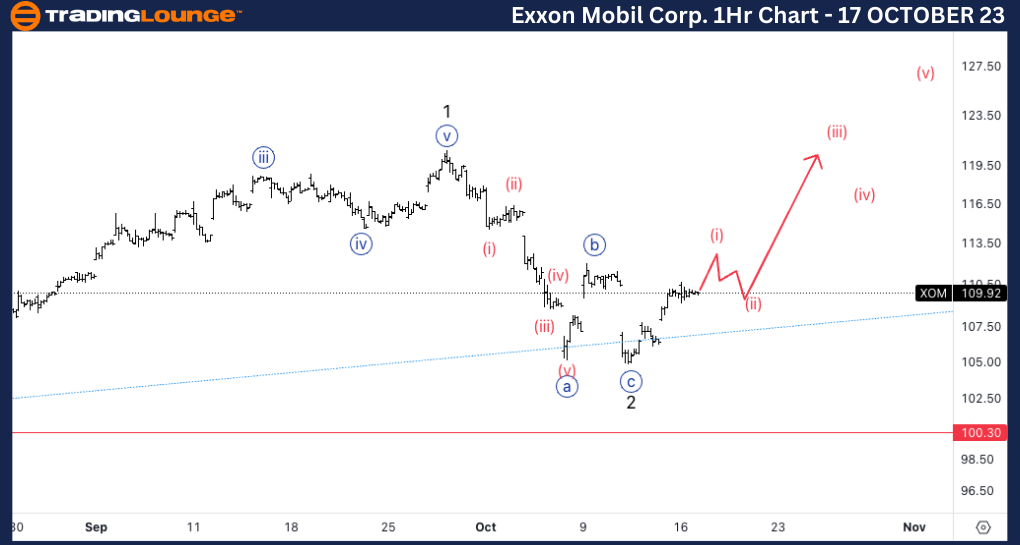
Exxon Mobil Corp., XOM: 1-hour Chart, 17 October 23
Exxon Mobil Corp., Elliott Wave Technical Analysis
XOM Stock Market Analysis: Looking for upside into wave (i) as we seem to have a three wave move and a potential wave iv of (i) in place. Looking for a three wave move afterwards from where you could look for short term trades.
XOM Elliott Wave count: Wave (iv) of {i}.
XOM Technical Indicators: 20EMA as support.
XOM Trading Strategy: Looking for a pullback in wave (ii) to then look for upside.