Natural Gas Elliott Wave Analysis: Deeper Decline Anticipated
Natural Gas experienced a brief recovery in early August, but indications point to a continuation of its downtrend, with potential to reach new August lows. The ongoing decline, initiated in June 2024, is expected to extend towards the Q1 2024 low, ranging between 1.5 and 1.6. If this scenario unfolds, Natural Gas could hit its lowest levels since September 2020.
Natural Gas Elliott Wave Technical Analysis
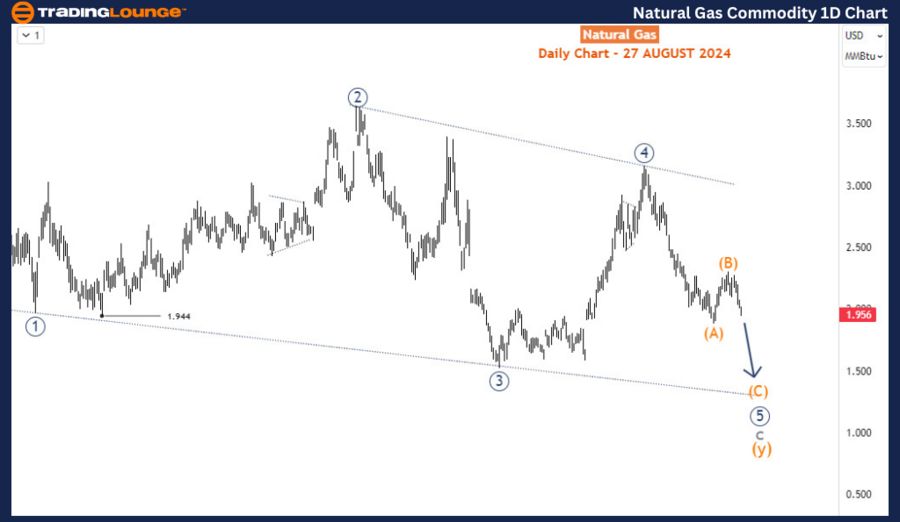
Natural Gas Daily Chart Analysis
On the daily chart, the long-term downtrend from the $10 peak in August 2022 is unfolding as a corrective pattern, labeled as waves a-b-c of the cycle degree. Wave a completed near 4.77, followed by a wave b rally that peaked around 7.61. Since November 2022, wave c has been progressing within an ending diagonal pattern, which typically signals the final phase of a corrective structure.
Currently, the market is in the 5th leg (wave 5, circled) of this diagonal pattern. This leg is developing as a three-wave structure and is anticipated to break below the previous low of wave 3 (circled) at 1.524, indicating further downside. The expected continuation of wave 5 (circled) is likely to form another three-wave move, ultimately completing the larger corrective pattern. Once this structure concludes, a significant bottom could be established, potentially leading to a longer-term reversal.
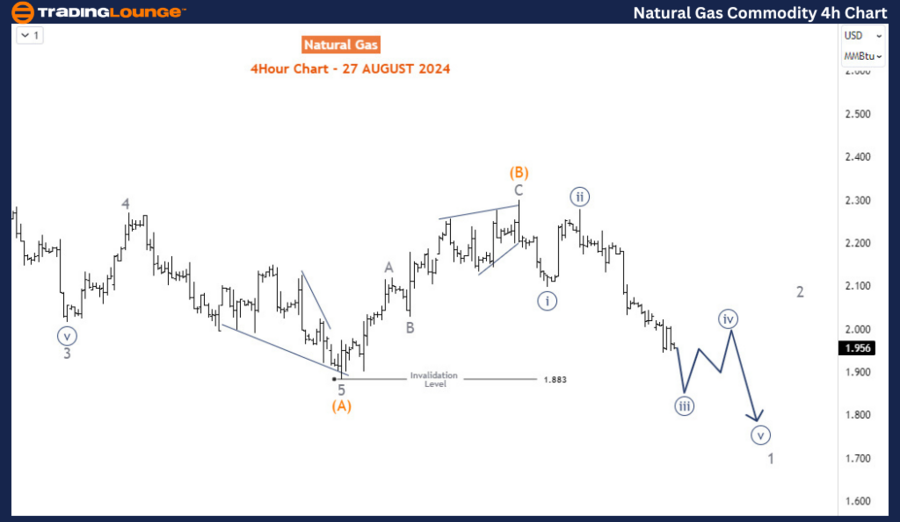
Natural Gas H4 Chart Analysis
The H4 chart offers a closer look at recent market movements. Wave (A) completed as an impulse sequence at 1.88 in early August 2024, marking the first leg of the current decline. Subsequently, wave (B) emerged, ending on August 15th with a shallow retracement. While wave (B) could extend into a double zigzag rally if support holds above 1.883, the overall trend remains bearish.
The decline from the August 15th high is evolving into an impulsive move, increasing the likelihood of a breach below 1.883. Once this support level breaks, wave (C) is expected to continue the decline, targeting levels below 1.5. Traders should monitor corrective bounces during this phase as potential selling opportunities, aligning with the broader bearish trend.
Summary
Natural Gas remains under pressure, with the technical structure pointing to further downside. The focus should be on selling rallies as the market approaches key support levels, aiming for a potential bottom in the 1.5 to 1.6 region.
Technical Analyst: Sanmi Adeagbo
Source: visit Tradinglounge.com and learn From the Experts Join TradingLounge Here
See Previous: Silver Elliott Wave Technical Analysis
Special Trial Offer - 0.76 Cents a Day for 3 Months! Click here
Access 7 Analysts Over 200 Markets Covered. Chat Room With Support