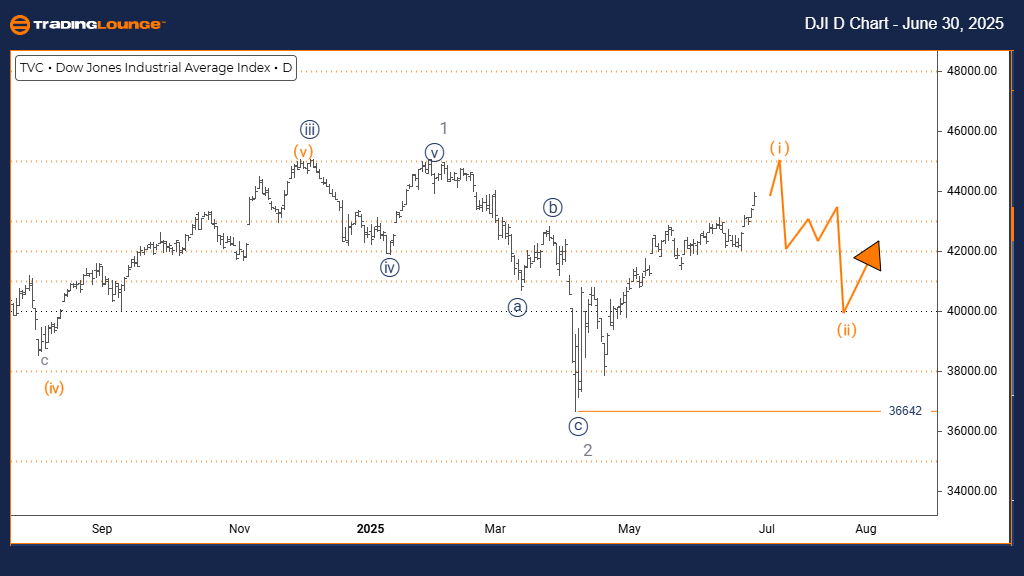
DJI Elliott Wave Analysis | Trading Lounge Daily Chart
Dow Jones DJI Index Daily Chart Analysis
Dow Jones DJI Index Elliott Wave Analysis
FUNCTION: Bullish Trend
MODE: Impulsive
STRUCTURE: Orange Wave 1
POSITION: Navy Blue Wave 1
DIRECTION NEXT LOWER DEGREES: Orange Wave 2
DETAILS: Gray Wave 2 appears complete. Currently, Orange Wave 1 of Navy Blue Wave 1 is developing.
Wave Cancellation Invalidation Level: 36,642
The daily Elliott Wave analysis of the Dow Jones Industrial Average (DJI) highlights a sustained bullish trend. Market behavior remains impulsive, reflecting robust upward momentum. The current Elliott Wave pattern is identified as Orange Wave 1, which forms a part of the broader Navy Blue Wave 1—signaling the start of a larger-scale upward move.
With Gray Wave 2 likely complete, the market is now advancing through Orange Wave 1, a subwave within Navy Blue Wave 1. This signals the onset of a potential multi-wave bullish rally. After Orange Wave 1 concludes, a corrective Orange Wave 2 is anticipated before the bullish trend resumes.
The critical invalidation level stands at 36,642. A decline below this level would invalidate the current wave count and necessitate a reevaluation. As long as this threshold holds, the chart supports a continuation of upward movement, affirming the bullish sentiment.
Based on current formations, the DJI appears positioned for continued gains, with Orange Wave 1 gaining strength. The completion of Gray Wave 2 supports the transition to a bullish phase, while impulsive momentum highlights buying strength and potential for higher price levels.
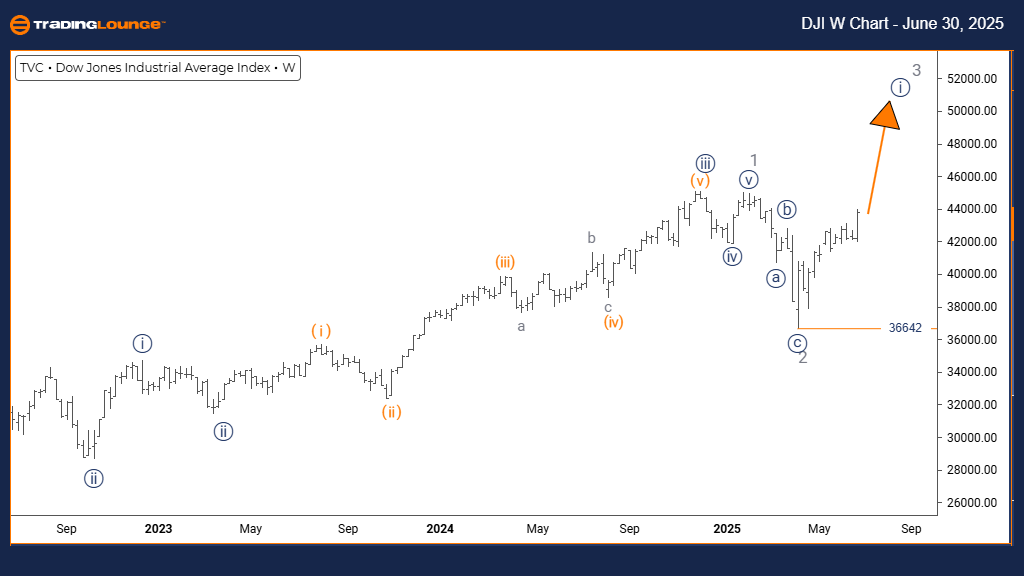
DJI Elliott Wave Analysis | Trading Lounge Weekly Chart
FUNCTION: Bullish Trend
MODE: Impulsive
STRUCTURE: Navy Blue Wave 1
POSITION: Gray Wave 3
DIRECTION NEXT LOWER DEGREES: Navy Blue Wave 2
DETAILS: Gray Wave 2 appears complete. Currently, Navy Blue Wave 1 of Gray Wave 3 is developing.
Wave Cancellation Invalidation Level: 36,642
The weekly Elliott Wave chart of the Dow Jones Index (DJI) confirms a bullish structure supported by impulsive price action. The active wave is Navy Blue Wave 1, part of the more expansive Gray Wave 3, suggesting the market may be entering a powerful upward cycle.
Following the apparent completion of Gray Wave 2, the development of Navy Blue Wave 1 within Gray Wave 3 is underway. This positioning marks the initial phase of a potentially strong third wave, traditionally associated with the most aggressive price advances in Elliott Wave theory. After the completion of Navy Blue Wave 1, a corrective Navy Blue Wave 2 is likely to emerge.
The key wave invalidation level is again placed at 36,642. A breach below this level would void the existing count and prompt an alternative scenario. Until then, the market structure remains bullish.
Technically, the DJI is entering the early stages of a broader uptrend, with impulsive action suggesting strong institutional buying. This reinforces the potential for further upside as Gray Wave 3 continues to unfold.
Technical Analyst: Malik Awais
Source: Visit Tradinglounge.com and learn from the Experts. Join TradingLounge Here
Previous: S&P/TSX 60 Index Elliott Wave Technical Analysis
VALUE Offer - $1 for 2 Weeks then $29 a month!Click here
Access 7 Analysts Over 200 Markets Covered. Chat Room With Support