27Jun

S&P/TSX 60 Elliott Wave Analysis Signals Strong Bullish Trend with Impulse Wave in Progress and Key Support at 1339 for Canadian Stocks

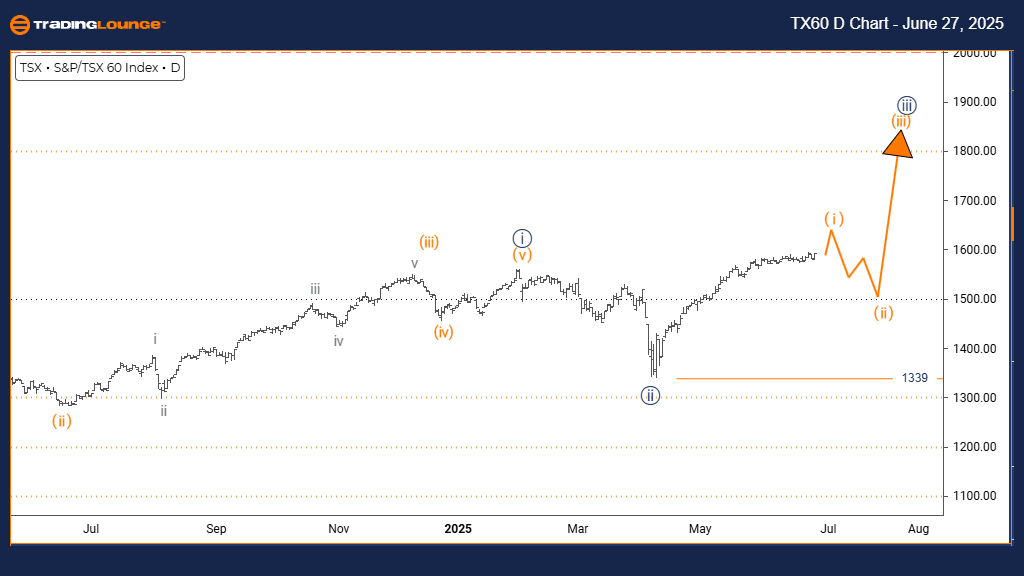
S&P/TSX 60 Elliott Wave Analysis – Trading Lounge Day Chart

S&P/TSX 60 Elliott Wave Technical Analysis

FUNCTION: Bullish Trend

MODE: Impulsive

STRUCTURE: Orange Wave 1

POSITION: Navy Blue Wave 3

DIRECTION NEXT LOWER DEGREES: Orange Wave 2

DETAILS: Navy Blue Wave 2 likely complete; Orange Wave 1 of 3 currently progressing.

Wave Cancel Invalidation Level: 1339

The S&P/TSX 60 daily Elliott Wave chart indicates a strong bullish trend. The current impulsive move, classified as Orange Wave 1, is part of the ongoing Navy Blue Wave 3, which signals upward strength and market optimism.

Navy Blue Wave 2 seems to have finalized, giving way to the formation of Orange Wave 1 within Navy Blue Wave 3. This transition highlights a shift into an impulsive breakout phase. The upcoming move to monitor is Orange Wave 2, which should act as a corrective retracement after Orange Wave 1 concludes.

The key technical level is 1339. Any price drop below this point would invalidate the current Elliott Wave setup. Maintaining levels above this threshold supports the bullish outlook.

Overall, the chart structure suggests that S&P/TSX 60 is well-positioned for further gains, with bullish momentum building within Navy Blue Wave 3. The impulse pattern points to growing market demand and potential for continued price appreciation.

TSX-D-INDEX-CHART-27...


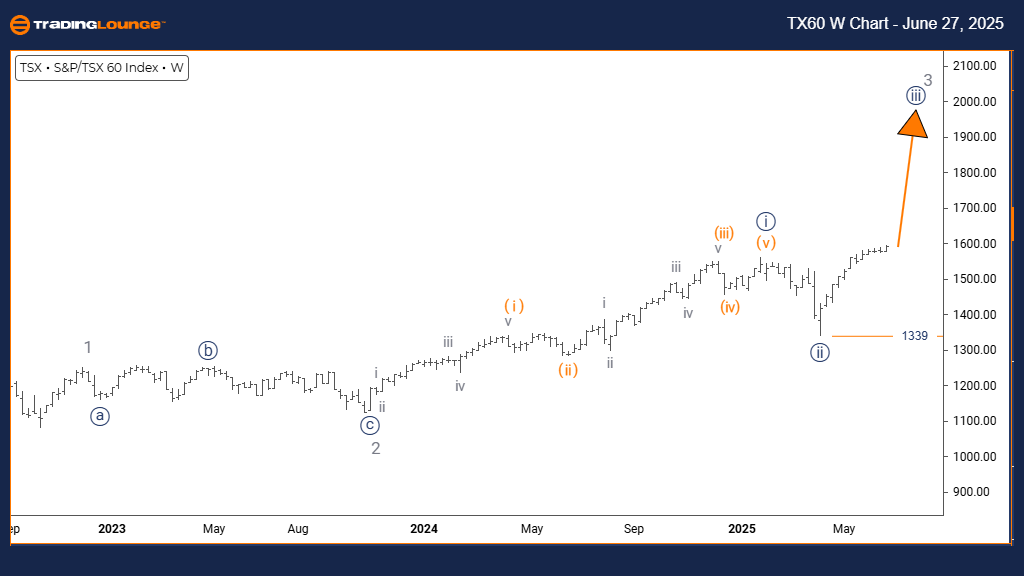
S&P/TSX 60 Elliott Wave Analysis – Trading Lounge Weekly Chart

S&P/TSX 60 Elliott Wave Technical Analysis

FUNCTION: Bullish Trend

MODE: Impulsive

STRUCTURE: Navy Blue Wave 3

POSITION: Gray Wave 3

DIRECTION NEXT LOWER DEGREES: Navy Blue Wave 3 (initiated)

DETAILS: Navy Blue Wave 2 completed; now Navy Blue Wave 3 within Gray Wave 3 is advancing.

Wave Cancel Invalidation Level: 1339

The weekly Elliott Wave outlook for the S&P/TSX 60 Index maintains a bullish stance. The market remains in a robust impulsive phase, currently within Navy Blue Wave 3, which forms a segment of the broader Gray Wave 3.

Following the conclusion of Navy Blue Wave 2, the index has entered the dynamic phase of Navy Blue Wave 3 inside Gray Wave 3. This suggests the start of an elongated upward trend, often marked by limited corrections and increasing investor confidence.

Keep a close eye on the 1339 level. A sustained move below it would call for a reassessment of the current bullish wave count. Staying above this line confirms strength in the ongoing wave cycle.

The technical configuration implies strong institutional buying and momentum within Navy Blue Wave 3, supporting the expectation of further upside movement in the S&P/TSX 60 in the medium term.

Technical Analyst: Malik Awais

Source: Visit Tradinglounge.com and learn from the Experts. Join TradingLounge Here

Previous: CAC 40 (France) Index Elliott Wave Technical Analysis

VALUE Offer - Buy 1 Month & Get 3 Months!Click here

Access 7 Analysts Over 200 Markets Covered. Chat Room With Support

TSX-W-INDEX-CHART-27...

Related

Corn Elliott Wave Analysis and Price Forecast: Bearish Trend, Technical Chart Patterns, and Long-Term Market Outlook Explained

Corn Elliott Wave Analysis and Price Forecast: Bearish Trend, Technical Chart Patterns, and Long-Term Market Outlook Explained

Corn Elliott Wave Analysis discusses the ongoing bearish trend from April 2022, the corrective bounc...

Read More >
Indian Stock Market Update on OIL & NATURAL Gas Co. Stock Analysis: ONGC Elliott Wave Technical Analysis & Price Prediction

Indian Stock Market Update on OIL & NATURAL Gas Co. Stock Analysis: ONGC Elliott Wave Technical Analysis & Price Prediction

Discover comprehensive ONGC stock analysis featuring Elliott Wave forecasts, technical analysis, and...

Read More >
META Stock Set to Soar: Meta Platforms Inc Elliott Wave Technical Analysis Reveals Key Targets and Trading Opportunities

META Stock Set to Soar: Meta Platforms Inc Elliott Wave Technical Analysis Reveals Key Targets and Trading Opportunities

This article provides an in-depth Elliott Wave analysis of Meta Platforms (META) stock, covering its...

Read More >
Elliott Wave Analysis: In-Depth Insights for S&P 500, NASDAQ 100, Russell 2000, DAX 40, FTSE 100 & ASX 200

Elliott Wave Analysis: In-Depth Insights for S&P 500, NASDAQ 100, Russell 2000, DAX 40, FTSE 100 & ASX 200

Unlock the power of Elliott Wave Analysis with our detailed examination of major global indices, inc...

Read More >
Commodities & Futures Market Analysis: Elliott Wave Insights & Strategies

Commodities & Futures Market Analysis: Elliott Wave Insights & Strategies

Discover profitable opportunities in the Commodities and Futures Trading Market with our comprehen...

Read More >

$1 for 2 Weeks

then $29 a month!

What a Special Offer!

Trade Recommendations

Unleash the power of deversified trading with our comprehensive portfolio, covering 250+ markets:

  • Stock Trades
  • Crypto Trades
  • Forex Trades
  • Commodity Trades
Elliott Wave Analysis

Gain a competitive edge with expert insights and AI-powered Elliott Wave charting into:

  • Global Indices
  • US Stocks & ASX Stocks
  • Forex & Crypto
  • Commodities
Top-Notch Trading Tools

Equip yourself with the tools of success:

  • Real-time Chat rooms
  • Elliott Wave Algorithm
  • Portfolio tools
  • TradingLevels
  • Screener
  • Trading Game
7 Elliott Wave Analysts

Stay ahead of the market with daily charts and insightful videos
Your secret to strategic trading!

JOIN HERE


Welcome to TradingLounge (ASIC A.R.No. 321187), specialists in trades, trading education and technical analysis, covering stocks, indices, commodities, forex and cryptocurrencies.

When you join TradingLounge you have access to everything we offer, including trade tools, educational content and a social platform to chat with like-minded investors.

Read more

@Copyright 2024 by tradinglounge.com

Contact Us

Australian no: 02 4787 6020

International no: +61 (2) 47876020

Pay with:

Find us on