26Jun

CAC 40 (France) Elliott Wave Analysis Forecasts for France Stock Market Trends and Trading Signals

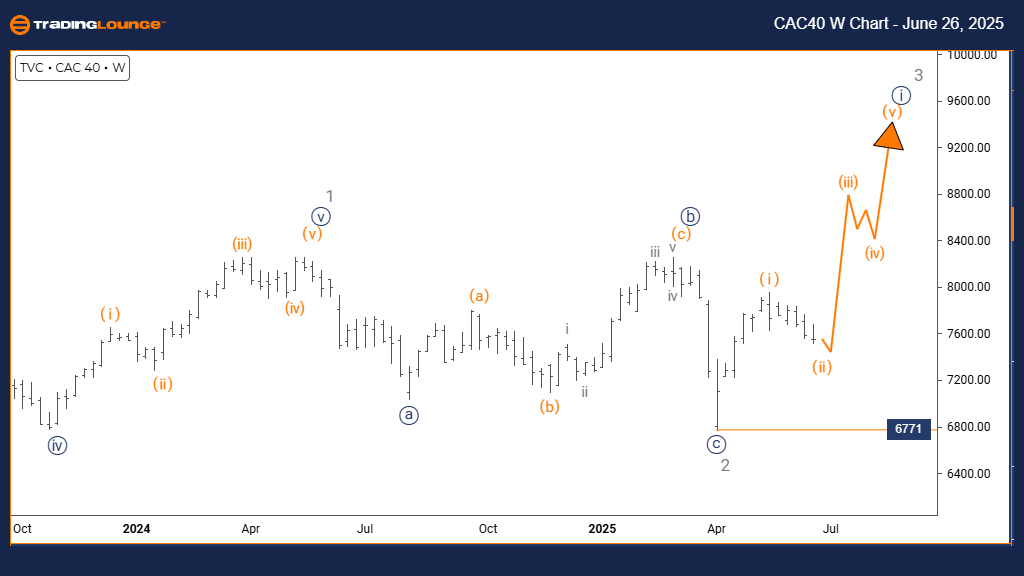
CAC 40 (France) Elliott Wave Analysis – Trading Lounge Day Chart

CAC 40 (France) Wave Technical Review

FUNCTION: Counter Trend

MODE: Corrective

STRUCTURE: Orange Wave 2

POSITION: Navy Blue Wave 1

DIRECTION NEXT HIGHER DEGREES: Orange Wave 3

DETAILS: Orange Wave 1 has likely completed; Orange Wave 2 is in progress

Wave Cancel/Invalidation Level: 6771

The Elliott Wave analysis of the CAC 40 daily chart reveals a counter-trend movement defined by a corrective structure. Presently, Orange Wave 2 is developing within the broader scope of Navy Blue Wave 1. This phase typically reflects a retracement that precedes a continuation of the overall bullish trend.

The shift from Orange Wave 1 to Orange Wave 2 marks a standard corrective phase, usually retracing part of the prior upward impulse. As Orange Wave 2 nears completion, the expectation shifts toward Orange Wave 3, signaling a potential resumption of the upward market trend.

At this stage, CAC 40 remains in Orange Wave 2, often representing range-bound conditions or moderate pullbacks. Its location within Navy Blue Wave 1 reinforces the corrective nature of the movement.

Traders should monitor for confirmation of Orange Wave 2’s end, as a breakout into Orange Wave 3 could suggest renewed bullish momentum. The critical invalidation level stands at 6771—any movement below this would call for a reassessment of the current wave count.

CAC40-d-index-chart-...


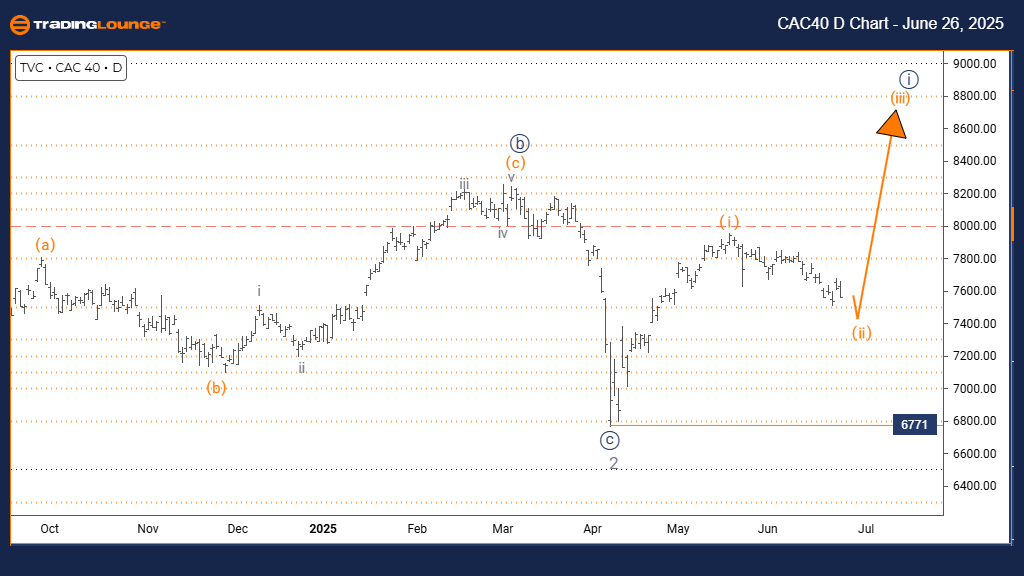
CAC 40 (France) Elliott Wave Analysis – Trading Lounge Weekly Chart

CAC 40 (France) Wave Technical Review

FUNCTION: Bullish Trend

MODE: Impulsive

STRUCTURE: Navy Blue Wave 1

POSITION: Gray Wave 3

DIRECTION NEXT LOWER DEGREES: Navy Blue Wave 2

DETAILS: Gray Wave 2 likely completed; Navy Blue Wave 1 of 3 is progressing

Wave Cancel/Invalidation Level: 6771

The weekly Elliott Wave review of CAC 40 outlines a bullish trend with impulsive price action. The active wave—Navy Blue Wave 1—forms part of a larger Gray Wave 3, indicating the initiation of a potentially strong upward market phase.

Following the apparent completion of Gray Wave 2, the development of Navy Blue Wave 1 highlights the beginning of a powerful third-wave movement. Once this impulse finalizes, Navy Blue Wave 2 is expected to introduce a brief corrective adjustment.

The wave invalidation threshold remains fixed at 6771. A break below this support would challenge the current wave interpretation, while a hold above it would sustain the bullish setup.

As Navy Blue Wave 1 unfolds post-Gray Wave 2, CAC 40 may benefit from strong upside momentum, largely driven by technical setups and institutional market activity continuing through Gray Wave 3.

Technical Analyst: Malik Awais

Source: Visit Tradinglounge.com and learn from the Experts. Join TradingLounge Here

Previous: NIFTY 50 Index Elliott Wave Technical Analysis

VALUE Offer - Buy 1 Month & Get 3 Months!Click here

Access 7 Analysts Over 200 Markets Covered. Chat Room With Support

CAC40-w-index-chart-...

Related

VanEck Gold Miners ETF – GDX Elliott Wave Analysis: Bullish Impulse Wave, Price Target, Support and Resistance Levels

VanEck Gold Miners ETF – GDX Elliott Wave Analysis: Bullish Impulse Wave, Price Target, Support and Resistance Levels

Elliott Wave analysis of the VanEck Gold Miners ETF (GDX), focusing on the powerful rally phase iden...

Read More >
PepsiCo Inc. (PEP) Elliott Wave Analysis: Key Support at $150 Signals Potential Wave 3 Rally and Long-Term Bullish Trend Reversal

PepsiCo Inc. (PEP) Elliott Wave Analysis: Key Support at $150 Signals Potential Wave 3 Rally and Long-Term Bullish Trend Reversal

PepsiCo (PEP) is approaching key support at $150, marking a potential bottom in Minor wave 2. A conf...

Read More >
Stay Informed with our Expert Analysis on ASX LIMITED - ASX Stock Analysis & Elliott Wave Technical Forecast

Stay Informed with our Expert Analysis on ASX LIMITED - ASX Stock Analysis & Elliott Wave Technical Forecast

Our detailed Elliott Wave analysis of ASX LIMITED provides valuable insights into current and future...

Read More >
Learn how to navigate Dogecoin Crypto Market Trends: DOGEUSD Elliott Wave Technical Analysis

Learn how to navigate Dogecoin Crypto Market Trends: DOGEUSD Elliott Wave Technical Analysis

This article thoroughly analyses Dogecoin (DOGEUSD) using Elliott Wave theory. It includes detailed ...

Read More >
ASX: Aristocrat Leisure Limited (ALL) Elliott Wave Technical Analysis, Stock Forecast, Price Target, Market Trends, and Predictions

ASX: Aristocrat Leisure Limited (ALL) Elliott Wave Technical Analysis, Stock Forecast, Price Target, Market Trends, and Predictions

This detailed Elliott Wave analysis of ASX: Aristocrat Leisure Limited (ALL) provides insights into ...

Read More >

$1 for 2 Weeks

then $29 a month!

What a Special Offer!

Trade Recommendations

Unleash the power of deversified trading with our comprehensive portfolio, covering 250+ markets:

  • Stock Trades
  • Crypto Trades
  • Forex Trades
  • Commodity Trades
Elliott Wave Analysis

Gain a competitive edge with expert insights and AI-powered Elliott Wave charting into:

  • Global Indices
  • US Stocks & ASX Stocks
  • Forex & Crypto
  • Commodities
Top-Notch Trading Tools

Equip yourself with the tools of success:

  • Real-time Chat rooms
  • Elliott Wave Algorithm
  • Portfolio tools
  • TradingLevels
  • Screener
  • Trading Game
7 Elliott Wave Analysts

Stay ahead of the market with daily charts and insightful videos
Your secret to strategic trading!

JOIN HERE


Welcome to TradingLounge (ASIC A.R.No. 321187), specialists in trades, trading education and technical analysis, covering stocks, indices, commodities, forex and cryptocurrencies.

When you join TradingLounge you have access to everything we offer, including trade tools, educational content and a social platform to chat with like-minded investors.

Read more

@Copyright 2024 by tradinglounge.com

Contact Us

Australian no: 02 4787 6020

International no: +61 (2) 47876020

Pay with:

Find us on