RUSSELL 2000 Elliott Wave Analysis – Trading Lounge Daily Chart
RUSSELL 2000 Index Daily Chart Analysis
RUSSELL 2000 Elliott Wave Technical Forecast
FUNCTION: Bullish Momentum
MODE: Impulsive Pattern
STRUCTURE: Orange Wave 1
POSITION: Navy Blue Wave 1
DIRECTION NEXT LOWER DEGREES: Orange Wave 2
DETAILS: Orange Wave 1, forming within Navy Blue Wave 1, signals a new bullish phase
CANCEL INVALIDATION LEVEL: 171
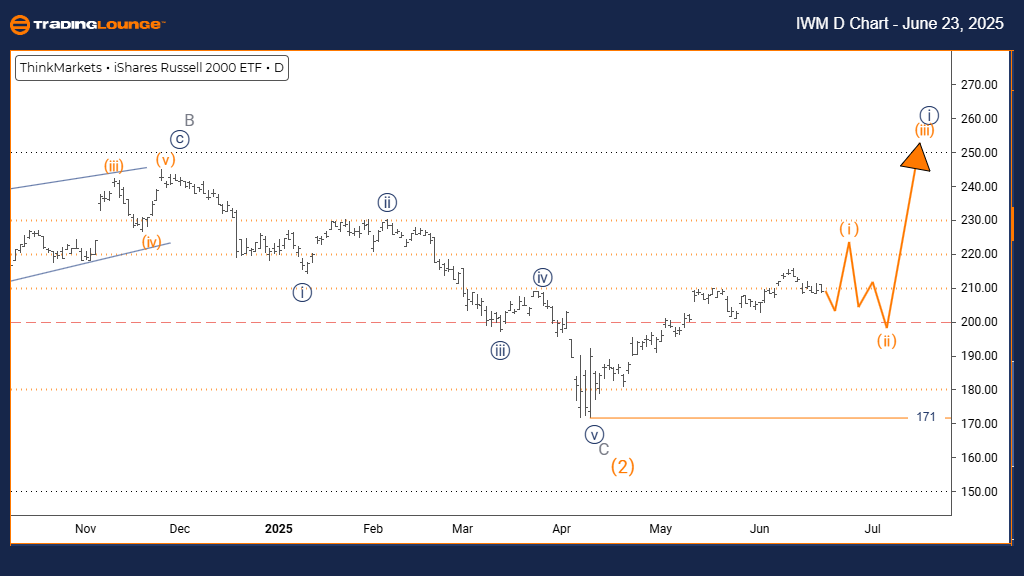
The RUSSELL 2000 index on the daily chart exhibits a clear bullish structure under the Elliott Wave theory. The current movement is categorized as impulsive, indicating sustained buying pressure. The ongoing structure, Orange Wave 1, is developing inside the broader Navy Blue Wave 1, suggesting the early stage of a new upward cycle.
Orange Wave 1 initiates a significant bullish pattern within Navy Blue Wave 1, typically marked by strong price increases driven by optimistic sentiment. Upon completion of this wave, a corrective phase—Orange Wave 2—is expected, reflecting a temporary pullback.
The key invalidation level is 171. If the index drops below this point, the existing wave interpretation becomes invalid. So long as prices remain above 171, the upward Elliott Wave structure retains its validity.
This technical scenario supports continued upside potential for the RUSSELL 2000, with Orange Wave 1 reinforcing bullish momentum. The impulsive nature of the current formation highlights the likelihood of ongoing price gains.
RUSSELL 2000 Elliott Wave Analysis – Trading Lounge Weekly Chart
RUSSELL 2000 Weekly Elliott Wave Technical Forecast
FUNCTION: Bullish Trend Development
MODE: Impulsive Formation
STRUCTURE: Navy Blue Wave 1
POSITION: Gray Wave 1
DIRECTION NEXT LOWER DEGREES: Navy Blue Wave 2
DETAILS: Navy Blue Wave 1 within Gray Wave 1 points to a strong emerging trend
CANCEL INVALIDATION LEVEL: 171
The weekly Elliott Wave analysis of the RUSSELL 2000 index suggests an expanding bullish trend. The impulsive structure now active, Navy Blue Wave 1, is forming as part of the larger Gray Wave 1—indicating the beginning of a possible long-term upward trajectory.
This pattern marks the foundational wave of Gray Wave 1, where Navy Blue Wave 1 usually brings renewed strength to the market. A pullback in the form of Navy Blue Wave 2 is expected to follow, which would serve as a technical correction.
The invalidation benchmark is set at 171. A move below this threshold would nullify the current count and trigger a revised analysis. Until then, the bullish scenario remains intact.
The wave structure on the weekly chart continues to support further gains for the RUSSELL 2000 index. The impulsive advance of Navy Blue Wave 1 highlights robust buying interest and opens the door to more upside in upcoming sessions.
Technical Analyst: Malik Awais
Source: Visit Tradinglounge.com and learn from the Experts. Join TradingLounge Here
Previous: Bovespa Index Elliott Wave Technical Analysis
VALUE Offer - $1 for 2 Weeks then $29 a month!Click here
Access 7 Analysts Over 200 Markets Covered. Chat Room With Support
