28Nov

Comprehensive Elliott Wave Analysis of TJX Companies Inc. with Daily and 1-Hour Chart Insights and Stock Projections

Elliott Wave Analysis of The TJX Companies Inc. (TJX): A Detailed Overview of Current Trends and Forecasts

This Elliott Wave analysis of The TJX Companies Inc. (TJX) provides insights into both the daily and 1-hour chart structures, offering a comprehensive outlook on the prevailing trends and potential price trajectories.

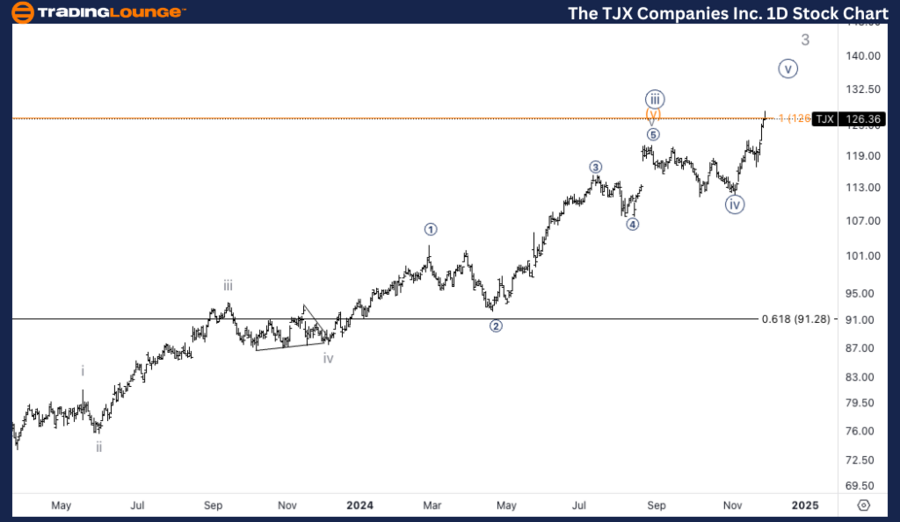
TJX Elliott Wave Analysis - TradingLounge Daily Chart

TJX Companies Inc. (TJX) Daily Chart Overview

TJX Elliott Wave Technical Analysis: Key Details

Function: Trend

Mode: Impulsive

Structure: Motive

Position: Wave {v} of 3 of (5)

Direction: Upside into wave 3

TJX Stock Technical Details:

  • Targeting an upside in wave {v} with projected equality of wave 3 vs. wave 1 at $126, nearing the end of MinorGroup1.

  • If bullish momentum persists, the next upside target is calculated at 1.618 times wave 1, positioning the price around $213.

TJX Daily Chart Insights

TJX is advancing within wave {v} of wave 3, part of the larger (5) wave structure. The stock is moving toward the completion of wave 3, with the equality of wave 3 vs. wave 1 suggesting a near-term target of $126, marking the end of MinorGroup1. If the upward momentum holds, the subsequent target at 1.618 times wave 1 would elevate the price potential to $213.

The-TJX-Companies-In...


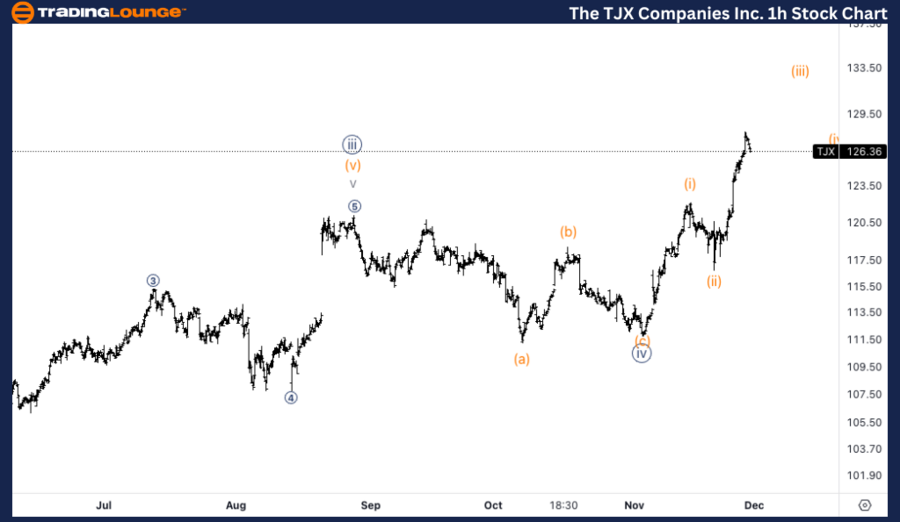
TJX Elliott Wave Analysis - TradingLounge 1-Hour Chart

TJX Companies Inc. (TJX) 1-Hour Chart Overview

TJX Stock Technical Analysis: Key Details

Function: Trend

Mode: Impulsive

Structure: Motive

Position: Wave (iii) of {v}

Direction: Upside in wave (iii)

TJX Technical Details:

  • Expecting further upside within wave (iii), as the five subwaves of this wave appear incomplete.

  • Continuation above $130 (the end of MinorGroup1) is anticipated during the completion of this impulsive wave.

TJX  1-Hour Chart Insights

On the 1-hour chart, TJX is progressing through wave (iii) of {v}, with further upside likely as the impulsive advance continues to unfold. The five subwaves within wave (iii) are incomplete, signaling potential movement above $130, which marks the endpoint of MinorGroup1.

Technical Analyst: Alessio Barretta

Source: visit Tradinglounge.com and learn From the Experts Join TradingLounge Here 

See Previous: Chevron Inc. (CVX) Elliott Wave Technical Analysis

VALUE Offer - Buy 1 Month & Get 3 Months!Click here

Access 7 Analysts Over 200 Markets Covered. Chat Room With Support

The-TJX-Companies-In...


Key Takeaways:

  • Daily Chart: Upside momentum targets $126, with extended potential to $213 based on wave projections.
  • 1-Hour Chart: Continuation above $130 expected as the impulsive pattern within wave (iii) develops further.

Related

ETF is Positioned for Growth as Clean Energy Investments Gain Momentum: GX Uranium Commodity Elliott Wave Technical Analysis

ETF is Positioned for Growth as Clean Energy Investments Gain Momentum: GX Uranium Commodity Elliott Wave Technical Analysis

The Global X Uranium ETF (GX URA) offers investors exposure to the growing uranium market, fueled by...

Read More >
Accurate Forecasts and Comprehensive Commodity Market Outlooks: WTI Crude Oil Commodity Elliott Wave Technical Analysis

Accurate Forecasts and Comprehensive Commodity Market Outlooks: WTI Crude Oil Commodity Elliott Wave Technical Analysis

This article provides an in-depth WTI Crude Oil analysis using Elliott Wave theory. Learn about the ...

Read More >
Coffee Commodity Elliott Wave Technical Analysis: Offering Traders key Insights and Strategies for Navigating the Coffee Market

Coffee Commodity Elliott Wave Technical Analysis: Offering Traders key Insights and Strategies for Navigating the Coffee Market

This article provides an in-depth Coffee Elliott Wave analysis, focusing on price trends and market ...

Read More >
The Procter & Gamble Company (PG) Elliott Wave Technical Analysis 9 February 24

The Procter & Gamble Company (PG) Elliott Wave Technical Analysis 9 February 24

Delve into the world of trading with a comprehensive analysis of Procter & Gamble (PG) stock using E...

Read More >
S&P 500, NASDAQ 100, BITCOIN, DAX 40, FTSE 100, ASX 200: Technical Analysis

S&P 500, NASDAQ 100, BITCOIN, DAX 40, FTSE 100, ASX 200: Technical Analysis

Bitcoin testing ATH, While the SP500 is completing an Elliott Wave 4 Triangle pattern. With US Stock...

Read More >
Complete Elliott Wave Technical Analysis for RUSSELL 2000 Index: RUT index Market Analysis | Best Russell 2000 stocks

Complete Elliott Wave Technical Analysis for RUSSELL 2000 Index: RUT index Market Analysis | Best Russell 2000 stocks

The Russell 2000 Elliott Wave analysis provides a comprehensive look at the market's current tre...

Read More >

Buy 1 Month

Get 3 Months!

Special Offer:

Trade Recommendations

Unleash the power of deversified trading with our comprehensive portfolio, covering:

  • Stock Trades
  • Crypto Trades
  • Forex Trades
  • Commodity Trades
Elliott Wave Analysis

Gain a competive edge with expert insights in to:

  • Global Indices
  • US Stocks & ASX Stocks
  • Forex & Crypto
  • Commodities
Top-Notch Trading Tools

Equip yourself with the tools of success:

  • Social Chat
  • Elliott Wave Algorithm
  • Screener
  • TradingLevels
  • Trading Game
7 Elliott Wave Analysts

Stay ahead of the market with daily charts and insightful videos
-Your secret to strategic trading!

JOIN HERE


Welcome to TradingLounge (ASIC A.R.No. 321187), specialists in trades, trading education and technical analysis, covering stocks, indices, commodities, forex and cryptocurrencies.

When you join TradingLounge you have access to everything we offer, including trade tools, educational content and a social platform to chat with like-minded investors.

Read more

@Copyright 2024 by tradinglounge.com

Contact Us

Australian no: 02 4787 6020

International no: +61 (2) 47876020

Pay with:

Find us on