17Apr

NextEra Energy (NEE) Approaches Bullish Reversal: Elliott Wave Analysis Highlights Key Technical Levels and Wave Forecast Targets

This Elliott Wave forecast for NextEra Energy Inc. (NEE) provides a detailed technical outlook based on both daily and intraday timeframes. The charts indicate that NEE is progressing through a corrective phase, which is approaching completion. A bullish reversal may follow as the current wave sequence finalises.

NextEra Energy Inc. (NEE) Elliott Wave Analysis – Tradinglounge Daily Chart

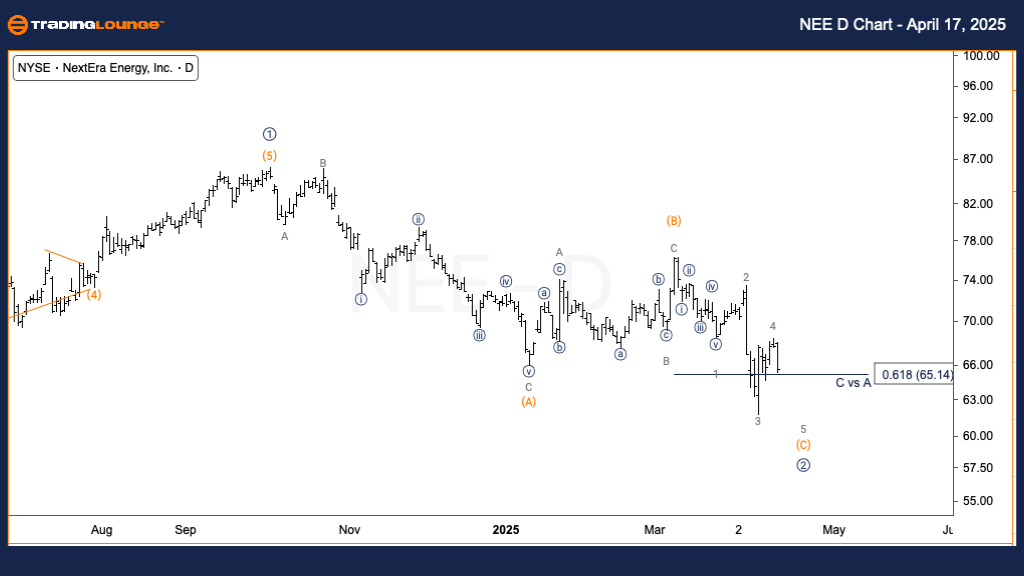
NextEra Energy Inc. (NEE) – Daily Chart Analysis

NEE Elliott Wave Technical Analysis

FUNCTION: Counter trend

MODE: Corrective

STRUCTURE: Flat

POSITION: Wave (C) of 2

DIRECTION: Bottoming in Wave (C)

DETAILS: Intermediate wave (C) is nearing completion within the broader Primary wave 2 correction. The structure displays a clear three-wave flat correction, suggesting a bullish trend resumption once this phase concludes.

Daily Chart Insight
The daily Elliott Wave chart for NEE shows a nearly complete flat correction within Primary wave 2. As Intermediate wave (C) unfolds, price action is entering a probable reversal zone. Once this corrective wave finalizes, a continuation of the broader uptrend is likely, making this a critical setup for bullish traders.

NEE-US-Stocks-Day-Ch...


NextEra Energy Inc. (NEE) – TradingLounge 1-Hour Chart

NEE Elliott Wave Technical Analysis

FUNCTION: Counter trend

MODE: Corrective

STRUCTURE: Flat

POSITION: Wave 4 of (C)

DIRECTION: Downward continuation into Wave 5

DETAILS: Wave 4 of (C) appears close to completion. A final leg lower in wave 5 of (C) is anticipated. The three-wave bounce from the April 9 low supports the wave 4 label, aligning with the expected structure.

1-Hour Chart Insight
The 1-hour chart supports the daily view, indicating wave 4 of (C) is wrapping up. A downward push in wave 5 of (C) is expected to complete the correction. The internal wave structure confirms the corrective profile, making this timeframe crucial for identifying a potential bullish pivot.

Technical Analyst: Alessio Barretta

Source: Visit Tradinglounge.com and learn from the Experts. Join TradingLounge Here 

Previous: PANW Elliott Wave Technical Analysis

VALUE Offer - Buy 1 Month & Get 3 Months!Click here

Access 7 Analysts Over 200 Markets Covered. Chat Room With Support

NEE-US-Stocks-1h-Cha...

Related

Key Levels and Patterns that Could Impact Visa's Stock Price: Visa Inc. (V) Stocks Elliott Wave Technical Analysis

Key Levels and Patterns that Could Impact Visa's Stock Price: Visa Inc. (V) Stocks Elliott Wave Technical Analysis

Our detailed Elliott Wave analysis for Visa Inc. (V) explores both daily and 1-hour charts to provid...

Read More >
Apple Inc.(AAPL:NASDAQ) Elliott Wave Technical Analysis 12 December 23

Apple Inc.(AAPL:NASDAQ) Elliott Wave Technical Analysis 12 December 23

Apple Inc. (AAPL: NASDAQ) Elliott Wave Technical Analysis dated 12 December 23, Elliott Wave Analysi...

Read More >
Technical Analysis of GX Uranium: GX Uranium Commodity Elliott Wave Analysis

Technical Analysis of GX Uranium: GX Uranium Commodity Elliott Wave Analysis

In an ever-evolving uranium market, the GX Uranium ETF (URA) stands out as a pivotal investment oppo...

Read More >
Commodities & Futures Market Analysis: Elliott Wave Insights & Strategies

Commodities & Futures Market Analysis: Elliott Wave Insights & Strategies

COMMODITY MARKETS: Bond Yields, USD Dollar DXY, US Gold, Silver, Iron Ore,Copper, Uranium, Oil, Gas

Read More >
ASX MINERAL RESOURCES LIMITED Elliott Wave Technical Analysis: MIN Set for Bullish Fifth‑Wave Rally with Key Invalidation Levels in Place

ASX MINERAL RESOURCES LIMITED Elliott Wave Technical Analysis: MIN Set for Bullish Fifth‑Wave Rally with Key Invalidation Levels in Place

Elliott Wave review on ASX: MIN reveals bullish fifth-wave potential. Key targets: $50–80, invalid...

Read More >
Mastering EURUSD Elliott Wave Technical Analysis: Key Insights for Daily and 4-Hour Forex Forecasts

Mastering EURUSD Elliott Wave Technical Analysis: Key Insights for Daily and 4-Hour Forex Forecasts

This EURUSD Elliott Wave analysis provides a comprehensive look at daily and 4-hour chart structures...

Read More >

$1 for 2 Weeks

then $29 a month!

What a Special Offer!

Trade Recommendations

Unleash the power of deversified trading with our comprehensive portfolio, covering 250+ markets:

  • Stock Trades
  • Crypto Trades
  • Forex Trades
  • Commodity Trades
Elliott Wave Analysis

Gain a competitive edge with expert insights and AI-powered Elliott Wave charting into:

  • Global Indices
  • US Stocks & ASX Stocks
  • Forex & Crypto
  • Commodities
Top-Notch Trading Tools

Equip yourself with the tools of success:

  • Real-time Chat rooms
  • Elliott Wave Algorithm
  • Portfolio tools
  • TradingLevels
  • Screener
  • Trading Game
7 Elliott Wave Analysts

Stay ahead of the market with daily charts and insightful videos
Your secret to strategic trading!

JOIN HERE


Welcome to TradingLounge (ASIC A.R.No. 321187), specialists in trades, trading education and technical analysis, covering stocks, indices, commodities, forex and cryptocurrencies.

When you join TradingLounge you have access to everything we offer, including trade tools, educational content and a social platform to chat with like-minded investors.

Read more

@Copyright 2024 by tradinglounge.com

Contact Us

Australian no: 02 4787 6020

International no: +61 (2) 47876020

Pay with:

Find us on