21May

Newmont Corporation (ASX:NEM) Elliott Wave Analysis Reveals Bullish Wave 3 Progression with $100 Target and Key Price Levels

ASX: Newmont Corporation – NEM Elliott Wave Technical Analysis – TradingLounge

Greetings,
This Elliott Wave analysis update covers Newmont Corporation (ASX: NEM), listed on the Australian Stock Exchange.

Our technical review indicates that ASX: NEM is advancing within a bullish wave three pattern. This report includes key price targets and invalidation levels to help assess the trend’s strength and sustainability.

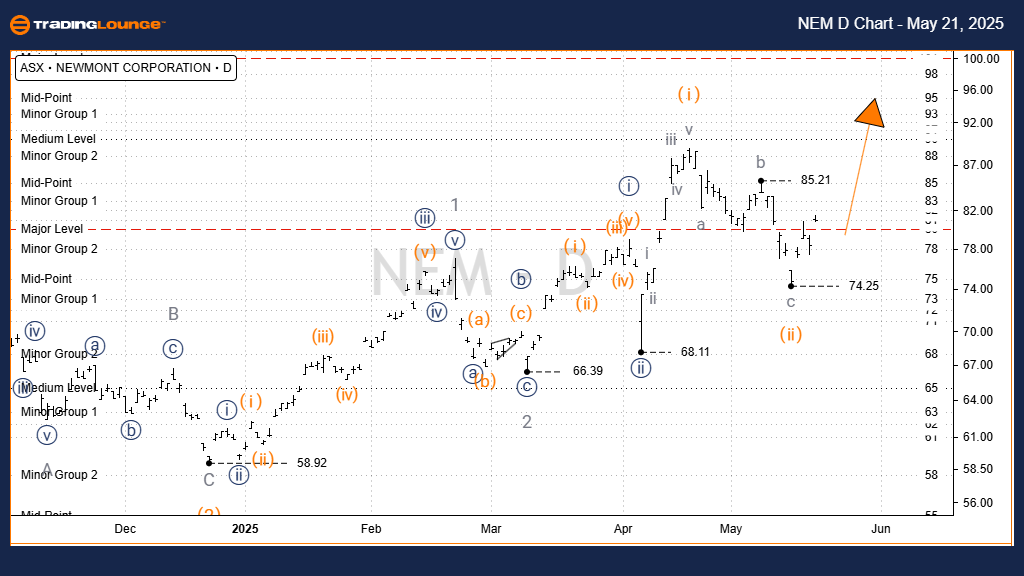
ASX: Newmont Corporation – NEM Elliott Wave Technical Analysis – Daily Chart (Semilog Scale)

Function: Major Trend (Minor Degree, Grey)

Mode: Motive

Structure: Impulse

Position: Wave (iii) – orange of Wave (iii) – navy of Wave 3 – grey

Analysis Overview:
The corrective wave ii) – orange appears complete at 74.25, forming a classic zigzag pattern (a, b, c – grey). Since reaching this low, wave iii) – orange has initiated an upward move, with a projected target near the 100.00 level.

Key Invalidation Level: 74.25

NEM-d-chart-asx-2105...


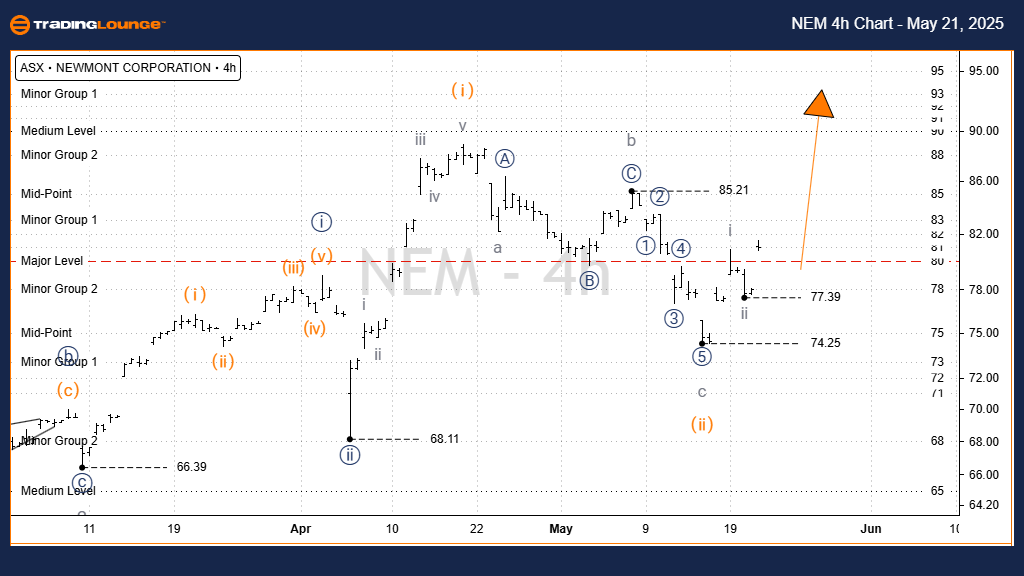
ASX: NEM Elliott Wave Technical Analysis – TradingLounge (4-Hour Chart)

Newmont Corporation 

Function: Major Trend (Minor Degree, Grey)

Mode: Motive

Structure: Impulse

Position: Wave iii) – orange of Wave ((iii)) – navy of Wave 3 – grey

Short-Term Forecast:

Consistent with the daily chart, wave iii) – orange continues to gain strength, maintaining an upward trajectory toward 100.00. In the near term, wave iii – grey is pushing higher with a closer target around 90.00.

Key Invalidation Level: 77.39

Technical Analyst: Hua (Shane) Cuong, CEWA-M (Master’s Designation).

Source: Visit Tradinglounge.com and learn from the Experts. Join TradingLounge Here 

See Previous: COCHLEAR LIMITED Elliott Wave Technical Analysis

VALUE Offer - Buy 1 Month & Get 3 Months!Click here

Access 7 Analysts Over 200 Markets Covered. Chat Room With Support

NEM-4h-chart-asx-210...


Conclusion:

This Elliott Wave forecast for ASX:NEM highlights both medium and short-term bullish momentum. The analysis delivers precise price objectives and invalidation markers to enhance decision-making confidence. For traders focused on ASX-listed mining stocks like Newmont Corporation, this structured technical outlook provides a reliable reference for identifying potential opportunities and risks.

Related

Elliott Wave Analysis of ASX:NAB – National Australia Bank Stock Forecast, Chart Outlook, and Technical Breakdown for Traders

Elliott Wave Analysis of ASX:NAB – National Australia Bank Stock Forecast, Chart Outlook, and Technical Breakdown for Traders

Elliott Wave breakdown of National Australia Bank (ASX:NAB), indicating a potential bullish phase. T...

Read More >
Unlocking ASX Trading Success: V300AEQ ETF UNITS – VAS Stock Analysis & Elliott Wave Technical Forecast

Unlocking ASX Trading Success: V300AEQ ETF UNITS – VAS Stock Analysis & Elliott Wave Technical Forecast

This article provides an in-depth Elliott Wave technical analysis of the ASX VAS ETF Units, highligh...

Read More >
Bovespa Index Elliott Wave Analysis: Bovespa Stock Picks, and a Technical View on Bullish and Bearish Signals in the Index Market

Bovespa Index Elliott Wave Analysis: Bovespa Stock Picks, and a Technical View on Bullish and Bearish Signals in the Index Market

This in-depth guide on Bovespa Index analysis covers essential trading insights, Elliott Wave interp...

Read More >
BTCUSD Elliott Wave analysis: Insights into Bitcoin's Wave Count, Potential Trend Reversals, and Price Movement Forecasts

BTCUSD Elliott Wave analysis: Insights into Bitcoin's Wave Count, Potential Trend Reversals, and Price Movement Forecasts

This article provides a detailed BTCUSD Elliott Wave analysis, focusing on Bitcoin's current mar...

Read More >
Russell 2000 Trading and Investing, Focusing on Elliott Wave Analysis, RUT Forecasts, and Technical Trends

Russell 2000 Trading and Investing, Focusing on Elliott Wave Analysis, RUT Forecasts, and Technical Trends

This article provides a comprehensive look into Russell 2000 trading and investing, focusing on Elli...

Read More >

$1 for 2 Weeks

then $29 a month!

What a Special Offer!

Trade Recommendations

Unleash the power of deversified trading with our comprehensive portfolio, covering 250+ markets:

  • Stock Trades
  • Crypto Trades
  • Forex Trades
  • Commodity Trades
Elliott Wave Analysis

Gain a competitive edge with expert insights and AI-powered Elliott Wave charting into:

  • Global Indices
  • US Stocks & ASX Stocks
  • Forex & Crypto
  • Commodities
Top-Notch Trading Tools

Equip yourself with the tools of success:

  • Real-time Chat rooms
  • Elliott Wave Algorithm
  • Portfolio tools
  • TradingLevels
  • Screener
  • Trading Game
7 Elliott Wave Analysts

Stay ahead of the market with daily charts and insightful videos
Your secret to strategic trading!

JOIN HERE


Welcome to TradingLounge (ASIC A.R.No. 321187), specialists in trades, trading education and technical analysis, covering stocks, indices, commodities, forex and cryptocurrencies.

When you join TradingLounge you have access to everything we offer, including trade tools, educational content and a social platform to chat with like-minded investors.

Read more

@Copyright 2024 by tradinglounge.com

Contact Us

Australian no: 02 4787 6020

International no: +61 (2) 47876020

Pay with:

Find us on