Copper Elliott Wave Analysis – March 2025 Update
Copper closed last week on a bullish note and is expected to extend its recovery from the January 2025 low. In the long-term outlook, copper is unfolding as a diagonal structure since March 2020, following a breakout from a 12-year range.
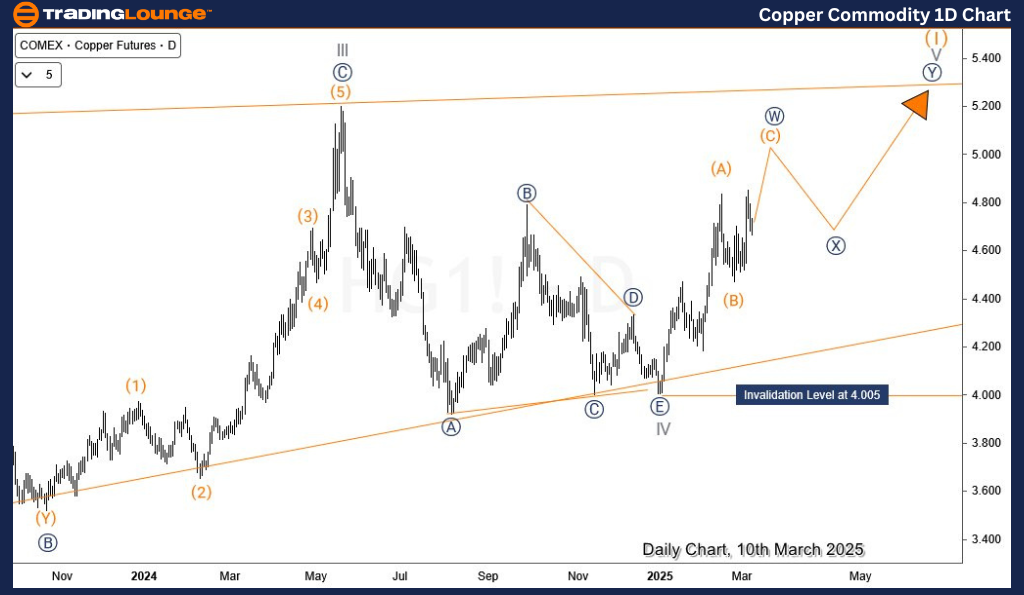
Copper Daily Chart Analysis
The long-term copper price trend suggests a diagonal formation beginning from the March 2020 lows. Based on the daily chart, wave IV of the diagonal pattern concluded in January 2025, initiating a resurgence into wave V of (I). From this low, the price structure indicates that it is either in wave (C) of ((W)) of V or has already transitioned into ((Y)) of V of (I). In both scenarios, the short-term outlook remains bullish until prices reach the I-III trendline resistance. Although the bullish cycle that started in March 2022 is nearing completion, short-term traders can still find opportunities in price retracements.
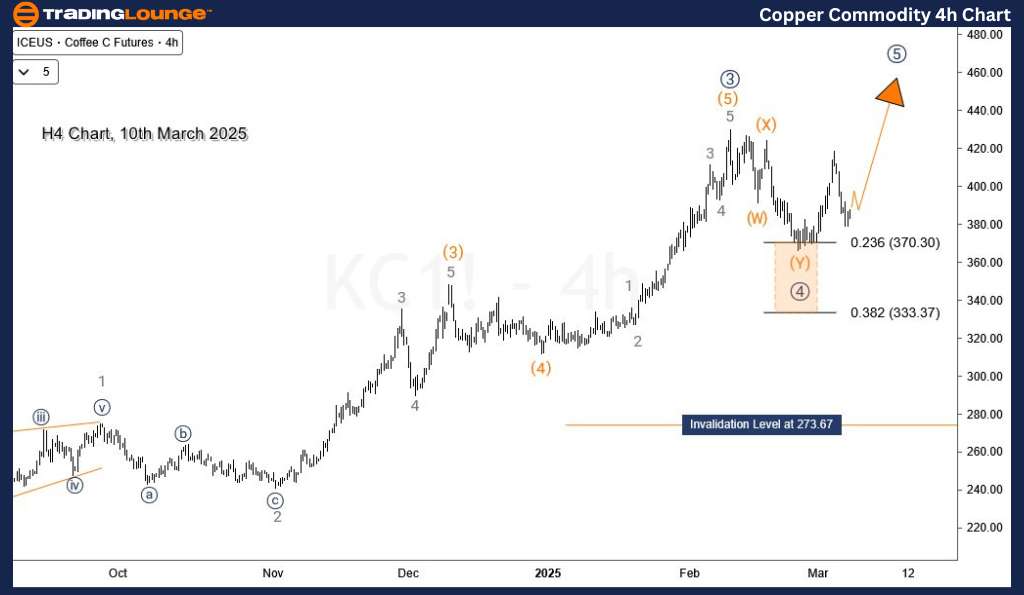
Copper H4 Chart Analysis
On the H4 timeframe, wave (C) of ((W)) is still in progress and is expected to reach the key psychological resistance level at 5,000 before a potential pullback in wave ((X)) offers new buying opportunities. As long as the February 2025 low holds, buyers should maintain dominance on pullbacks, driving copper prices higher in the coming sessions.
Technical Analyst: Sanmi Adeagbo
Source: visit Tradinglounge.com and learn From the Experts Join TradingLounge Here
See Previous: Wheat Elliott Wave Technical Analysis
VALUE Offer - Buy 1 Month & Get 3 Months!Click here
Access 7 Analysts Over 200 Markets Covered. Chat Room With Support