Silver Elliott Wave Technical Analysis – February 2025

Silver has surged 12% since late January, retracing the five-wave impulse sequence that began on December 19. Despite the ongoing correction, the long-term trend remains bullish, with buyers anticipating new entry points for the next upward move.

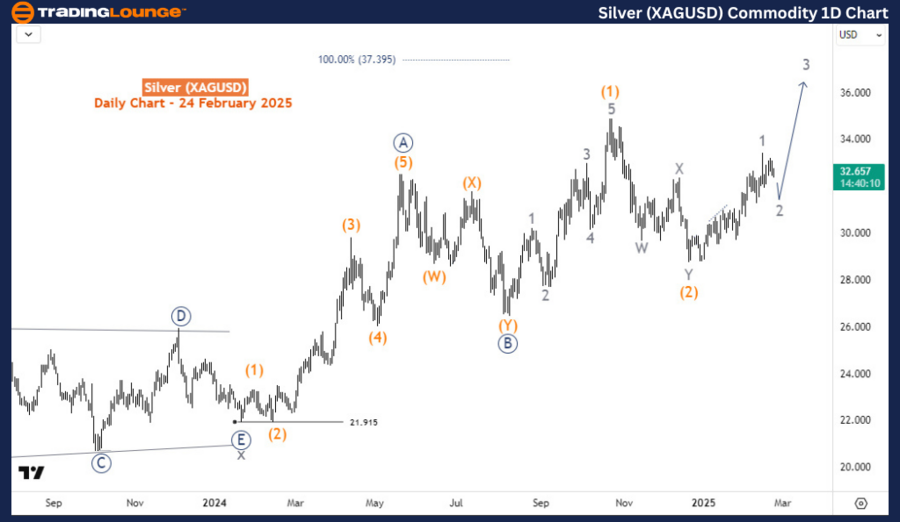
Silver (XAGUSD) Commodities Daily Chart Analysis

On the daily chart, Silver completed wave (2) of a larger impulse sequence that started from the August 2024 low. Wave (2) ended at $28.7, marking the beginning of the current bullish momentum. From this level, an impulse wave structure for wave 1 of (3) appears to have concluded, leading to a corrective wave 2.

Analyzing the broader bullish cycle from the 21.915 low, Silver is likely forming either an ((A))-((B))-((C)) corrective sequence or a full ((1))-((2))-((3))-((4))-((5)) impulsive structure. This suggests the uptrend still has significant room to extend. As a result, traders should look for opportunities to buy pullbacks in alignment with the prevailing bullish sentiment.

Silver-XAGUSD-Commod...


Silver (XAGUSD) Commodities H4 Chart Analysis

On the H4 chart, wave 2 may unfold as either a zigzag or a double zigzag correction. If it forms a zigzag pattern, Silver should find support in the 31.719-30.795 Fibonacci retracement zone, setting the stage for wave 3 to drive prices higher.

Alternatively, if the reaction within this zone remains corrective, wave 3 could extend lower in a double correction pattern, with strong support expected above the 28.743 low. As long as Silver holds above this key level, buyers are likely to re-enter the market, reinforcing the bullish outlook.

Technical Analyst: Sanmi Adeagbo

Source: visit Tradinglounge.com and learn From the Experts Join TradingLounge Here 

See Previous: Natural Gas Elliott Wave Technical Analysis

VALUE Offer - Buy 1 Month & Get 3 Months!Click here

Access 7 Analysts Over 200 Markets Covered. Chat Room With Support

Silver-(XAGUSD)-Comm...


Key Takeaways:
Silver has gained 12% since late January, retracing its previous five-wave impulse sequence.
Wave (2) completed at $28.7, signaling the start of a new bullish cycle.
The ongoing correction in wave 2 presents a potential buying opportunity.
Key Fibonacci support levels: 31.719-30.795 and 28.743.
A confirmed breakout from wave 2 correction should lead to a strong wave 3 rally.

Related

Dogecoin Crypto Price prediction News using DOGEUSD Elliott Wave Technical Analysis with Charts Insight

Dogecoin Crypto Price prediction News using DOGEUSD Elliott Wave Technical Analysis with Charts Insight

This analysis provides a detailed Dogecoin price prediction using DOGEUSD Elliott Wave analysis. Lea...

Read More >
DOW JONES (DJI) Index Elliott Wave Technical Analysis Identifies Current Market Trends Help Traders to Navigate Movements

DOW JONES (DJI) Index Elliott Wave Technical Analysis Identifies Current Market Trends Help Traders to Navigate Movements

DOW JONES (DJI) Elliott Wave Analysis identifies current market trends and wave patterns to help tra...

Read More >
S&P BSE Sensex (India) Elliott Wave Analysis: Bullish Trend Forecast, Impulse Wave Patterns, Stock Market Outlook & Trading Strategy

S&P BSE Sensex (India) Elliott Wave Analysis: Bullish Trend Forecast, Impulse Wave Patterns, Stock Market Outlook & Trading Strategy

Elliott Wave forecast for the S&P BSE Sensex, covering both daily and weekly charts. It confirms a b...

Read More >
VeChain/USD Elliott Wave Technical Analysis: Trend Following with Impulsive Structure

VeChain/USD Elliott Wave Technical Analysis: Trend Following with Impulsive Structure

The latest Elliott Wave analysis for VeChain/USD (VETUSD) on both daily and 4-hour charts suggests a...

Read More >
TASI Index Elliott Wave Technical Analysis: Detailing its Current and Projected Market Movements.

TASI Index Elliott Wave Technical Analysis: Detailing its Current and Projected Market Movements.

This article provides an in-depth Elliott Wave analysis of the TASI Index, detailing its current and...

Read More >
BNBUSD Price Surge Predicted: BNB Crypto News Today Elliott Wave Technical Analysis Reveals Binance Coin's Next Big Move

BNBUSD Price Surge Predicted: BNB Crypto News Today Elliott Wave Technical Analysis Reveals Binance Coin's Next Big Move

Discover the latest BNBUSD price analysis using Elliott Wave theory. This comprehensive breakdown of...

Read More >

Buy 1 Month

Get 3 Months!

Special Offer:

Trade Recommendations

Unleash the power of deversified trading with our comprehensive portfolio, covering:

  • Stock Trades
  • Crypto Trades
  • Forex Trades
  • Commodity Trades
Elliott Wave Analysis

Gain a competive edge with expert insights in to:

  • Global Indices
  • US Stocks & ASX Stocks
  • Forex & Crypto
  • Commodities
Top-Notch Trading Tools

Equip yourself with the tools of success:

  • Social Chat
  • Elliott Wave Algorithm
  • Screener
  • TradingLevels
  • Trading Game
7 Elliott Wave Analysts

Stay ahead of the market with daily charts and insightful videos
-Your secret to strategic trading!

JOIN HERE


Welcome to TradingLounge (ASIC A.R.No. 321187), specialists in trades, trading education and technical analysis, covering stocks, indices, commodities, forex and cryptocurrencies.

When you join TradingLounge you have access to everything we offer, including trade tools, educational content and a social platform to chat with like-minded investors.

Read more

@Copyright 2024 by tradinglounge.com

Contact Us

Australian no: 02 4787 6020

International no: +61 (2) 47876020

Pay with:

Find us on