Avery Dennison Corp. (AVY) Elliott Wave Analysis: Daily and 1-Hour Charts

This Elliott Wave analysis of Avery Dennison Corp. (AVY) reviews both the daily and 1-hour charts to provide insight into current market trends and potential future price movements. The analysis leverages Elliott Wave Theory to forecast AVY's next potential moves.

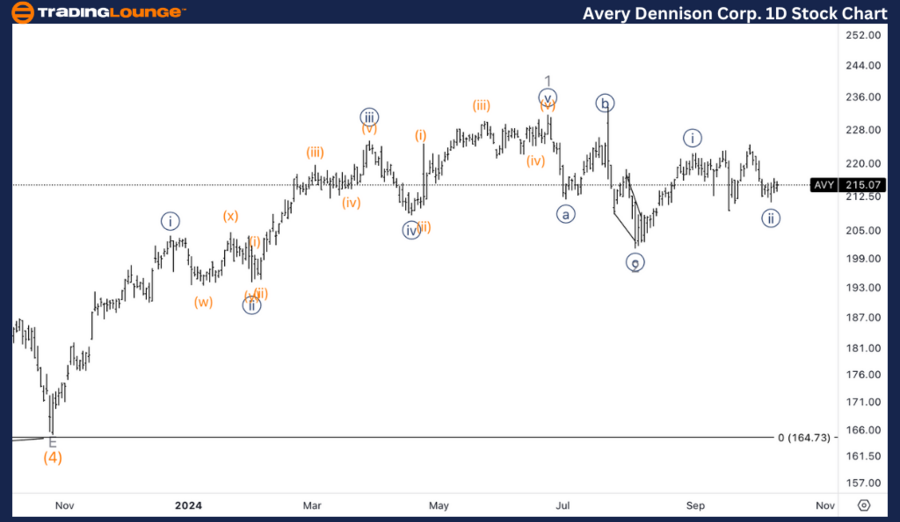
AVY Elliott Wave Analysis - TradingLounge Daily Chart

Avery Dennison Corp. (AVY) Daily Chart Overview

AVY Elliott Wave Technical Analysis

Function: Trend

Mode: Impulsive

Structure: Motive

Position: Wave 3

Direction: Upside in Wave 3

Details: A bottom in Minor wave 2 appears to be in place around the $200 mark. The structure suggests another {i}-{ii} of wave 3 has completed, signaling a potential upward movement is ready to unfold.

AVY Elliott Wave Analysis – Daily Chart Breakdown

On the daily chart, Avery Dennison (AVY) seems to have completed Minor wave 2 at around $200. With the initial {i}-{ii} of wave 3 already formed, the stock looks set for a significant upward move. Wave 3 is often the strongest in an impulsive wave structure, indicating a potential rally in AVY’s price in the near term. This upward trajectory suggests a bullish outlook for the stock, driven by wave 3's impulsive behavior.

Avery-Dennison-Corp-...


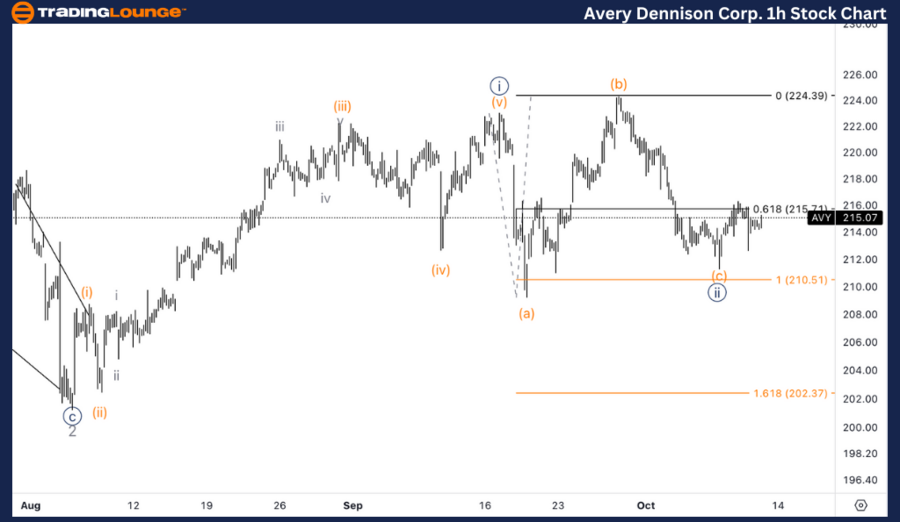
AVY Elliott Wave Analysis - TradingLounge 1-Hour Chart

Avery Dennison Corp. (AVY) 1-Hour Chart Overview

AVY Elliott Wave Technical Analysis

Function: Trend

Mode: Impulsive

Structure: Motive

Position: Wave {ii}

Direction: Bottom in Wave {ii}

Details: The stock has likely completed wave {ii}, reaching the equality of (c) vs. (a). Now, the focus shifts to wave {iii}, and the stock needs to find support above $220 to confirm the bullish momentum.

AVY Elliott Wave Analysis – 1-Hour Chart Breakdown

On the 1-hour chart, Avery Dennison (AVY) shows signs of completing wave {ii}, having reached the equality of (c) vs. (a). For the stock to continue its upward move into wave {iii}, it must hold support above $220. Maintaining this support level will likely confirm the bullish outlook, paving the way for a potential strong upward movement in wave {iii}.

Technical Analyst: Alessio Barretta

Source: visit Tradinglounge.com and learn From the Experts Join TradingLounge Here 

See Previous: The Boeing Company (BA) Elliott Wave Technical Analysis

VALUE Offer - Buy 1 Month & Get 3 Months!Click here

Access 7 Analysts Over 200 Markets Covered. Chat Room With Support

Avery-Dennison-Corp-...

Related

Amazon Stock Elliott Wave Analysis: AMZN Forecast Shows Corrective Zigzag Pattern with $159 Price Target and Potential Reversal Ahead

Amazon Stock Elliott Wave Analysis: AMZN Forecast Shows Corrective Zigzag Pattern with $159 Price Target and Potential Reversal Ahead

Elliott Wave analysis of Amazon (AMZN) stock using daily and hourly charts. It identifies a correcti...

Read More >
Expert Technical Analysis for Optimal Trading: WiseTech Global Limited (ASX: WTC) Elliott Wave Analysis

Expert Technical Analysis for Optimal Trading: WiseTech Global Limited (ASX: WTC) Elliott Wave Analysis

Explore our detailed Elliott Wave analysis of WiseTech Global Limited (ASX: WTC). Understand current...

Read More >
Unlocking ASX Trading Success: WISETECH GLOBAL LIMITED – WTC Stock Analysis & Elliott Wave Technical Forecast

Unlocking ASX Trading Success: WISETECH GLOBAL LIMITED – WTC Stock Analysis & Elliott Wave Technical Forecast

This article provides an in-depth Elliott Wave technical analysis of Wisetech Global Limited (WTC) o...

Read More >
ASX Trading: Insurance Australia Group (ASX:IAG) Stock Analysis and Elliott Wave Technical Forecast for Smarter Investing

ASX Trading: Insurance Australia Group (ASX:IAG) Stock Analysis and Elliott Wave Technical Forecast for Smarter Investing

Elliott Wave technical analysis of Insurance Australia Group Limited (ASX:IAG). It outlines the curr...

Read More >
GX Uranium Commodity Elliott Wave Technical Analysis: ETF's Price Trends, Long-term Forecast, and Key Buy Signals

GX Uranium Commodity Elliott Wave Technical Analysis: ETF's Price Trends, Long-term Forecast, and Key Buy Signals

The GX Uranium ETF offers investors a unique opportunity in the uranium sector, supported by rising ...

Read More >
Fortinet Inc. (FTNT) Stocks Elliott Wave Technical Analysis: Valuable Insights into FTNT’s next Price Movements and Trend

Fortinet Inc. (FTNT) Stocks Elliott Wave Technical Analysis: Valuable Insights into FTNT’s next Price Movements and Trend

This Elliott Wave analysis provides an in-depth look at Fortinet Inc. (FTNT) stock, reviewing the cu...

Read More >

$1 for 2 Weeks

then $29 a month!

What a Special Offer!

Trade Recommendations

Unleash the power of deversified trading with our comprehensive portfolio, covering 250+ markets:

  • Stock Trades
  • Crypto Trades
  • Forex Trades
  • Commodity Trades
Elliott Wave Analysis

Gain a competitive edge with expert insights and AI-powered Elliott Wave charting into:

  • Global Indices
  • US Stocks & ASX Stocks
  • Forex & Crypto
  • Commodities
Top-Notch Trading Tools

Equip yourself with the tools of success:

  • Real-time Chat rooms
  • Elliott Wave Algorithm
  • Portfolio tools
  • TradingLevels
  • Screener
  • Trading Game
7 Elliott Wave Analysts

Stay ahead of the market with daily charts and insightful videos
Your secret to strategic trading!

JOIN HERE


Welcome to TradingLounge (ASIC A.R.No. 321187), specialists in trades, trading education and technical analysis, covering stocks, indices, commodities, forex and cryptocurrencies.

When you join TradingLounge you have access to everything we offer, including trade tools, educational content and a social platform to chat with like-minded investors.

Read more

@Copyright 2024 by tradinglounge.com

Contact Us

Australian no: 02 4787 6020

International no: +61 (2) 47876020

Pay with:

Find us on