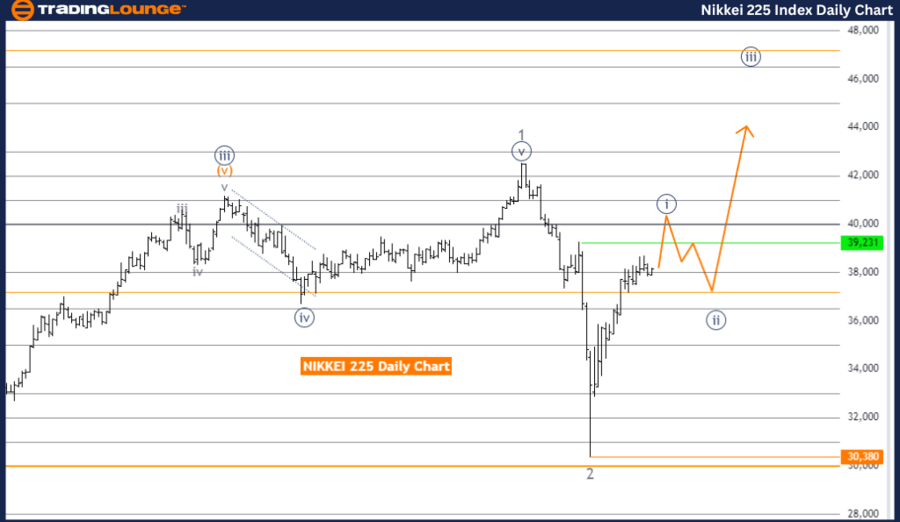
NIKKEI 225 (N225) Elliott Wave Analysis Trading Lounge Day Chart
NIKKEI 225 (N225) Day Chart Analysis
NIKKEI 225 (N225) Elliott Wave Technical Analysis
Function: Bullish Trend
Mode: Impulsive
Structure: Navy Blue Wave 1
Position: Gray Wave 3
Direction Next Lower Degrees: Navy Blue Wave 2
Details: Gray Wave 2 appears completed; Navy Blue Wave 1 is now active.
Wave Cancel Invalid Level: 30,380
The NIKKEI 225 is currently in a bullish trend, according to the Elliott Wave analysis on the daily chart. The market is moving in an impulsive mode, suggesting a strong upward momentum. The key structure under analysis is Navy Blue Wave 1, which indicates the start of a larger upward movement. Presently, the market is in Gray Wave 3, signaling that this phase is still in progress with further potential for upward movement.
The analysis suggests that Gray Wave 2 has likely concluded, meaning the market has completed its corrective phase and is now advancing into Navy Blue Wave 1. This transition sets the stage for the continuation of the bullish trend, with expectations for further gains as Navy Blue Wave 1 develops. The next lower degree direction points to Navy Blue Wave 2, implying that after the current upward movement, a corrective phase may occur before the trend resumes its upward trajectory.
A crucial level to monitor is 30,380, known as the Wave Cancel Invalid Level. If the price falls below this level, the current wave structure would be invalidated, which could indicate a possible change in the market's direction or even a trend reversal. Traders should keep a close eye on this level to determine if the bullish trend remains intact or if market dynamics begin to shift.
In summary, the NIKKEI 225 is in a bullish impulsive trend on the daily chart, currently positioned in Gray Wave 3 of Navy Blue Wave 1. The trend is expected to continue upward, but the 30,380 level is critical to watch, as a break below it could invalidate the current wave structure and suggest a potential trend shift.
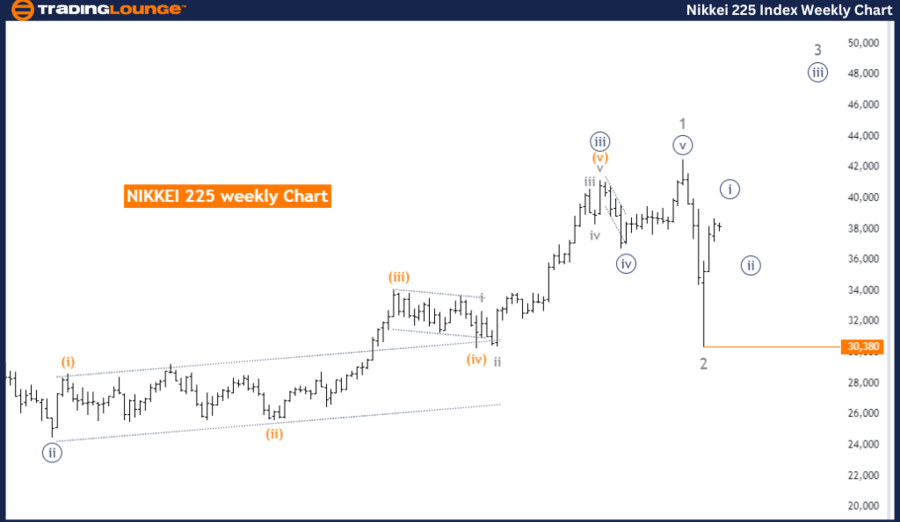
NIKKEI 225 (N225) Elliott Wave Analysis Trading Lounge Weekly Chart
NIKKEI 225 (N225) Elliott Wave Technical Analysis
Function: Bullish Trend
Mode: Impulsive
Structure: Navy Blue Wave 1
Position: Gray Wave 3
Direction Next Lower Degrees: Navy Blue Wave 2
Details: Gray Wave 2 appears completed; Navy Blue Wave 1 is now active.
Wave Cancel Invalid Level: 30,380
The NIKKEI 225 is currently exhibiting a bullish trend based on the Elliott Wave analysis on the weekly chart. This analysis shows that the market is advancing in an impulsive mode, indicating strong upward momentum. The primary structure being observed is Navy Blue Wave 1, which marks the beginning of a significant upward movement in the broader trend. The market is currently in Gray Wave 3, indicating that this phase of the trend is still ongoing with further potential for gains.
The analysis points out that Gray Wave 2 appears to have concluded, meaning the market has completed its corrective phase and is now advancing within Navy Blue Wave 1. This completion sets the stage for continued upward movement as Navy Blue Wave 1 progresses. The direction for the next lower degrees indicates Navy Blue Wave 2, suggesting that after the current upward movement, a corrective phase may occur before the trend continues its upward path.
A critical level to monitor is 30,380, referred to as the Wave Cancel Invalid Level. If the price drops below this level, the current wave structure would be invalidated, potentially signaling a change in the market's direction or a trend reversal. Traders should closely observe this level to assess whether the bullish trend remains intact or if there are signs of a shift in market dynamics.
In summary, the NIKKEI 225 is in a bullish impulsive trend on the weekly chart, currently positioned in Gray Wave 3 of Navy Blue Wave 1. The trend is expected to continue upward, but the 30,380 level is a critical point to watch. A break below this level could invalidate the current wave structure, indicating a potential change in the market trend.
Technical Analyst: Malik Awais
Source: visit Tradinglounge.com and learn From the Experts Join TradingLounge Here
Previous: S&P 500 Index Elliott Wave Technical Analysis
Special Trial Offer - 0.76 Cents a Day for 3 Months! Click here
Access 7 Analysts Over 200 Markets Covered. Chat Room With Support