23Jan

Our Expert Analysis Provides Wheat Commodity Elliott Wave Technical Analysis: Insights into Wheat Futures, Technical Indicators, and Trading Strategies

Wheat Elliott Wave Technical Analysis

Wheat prices continue to exhibit bearish trends despite the recent rebound from the January low. The ongoing bounce is anticipated to remain below the October 2024 high before resuming the broader downward trend that started in March 2022.

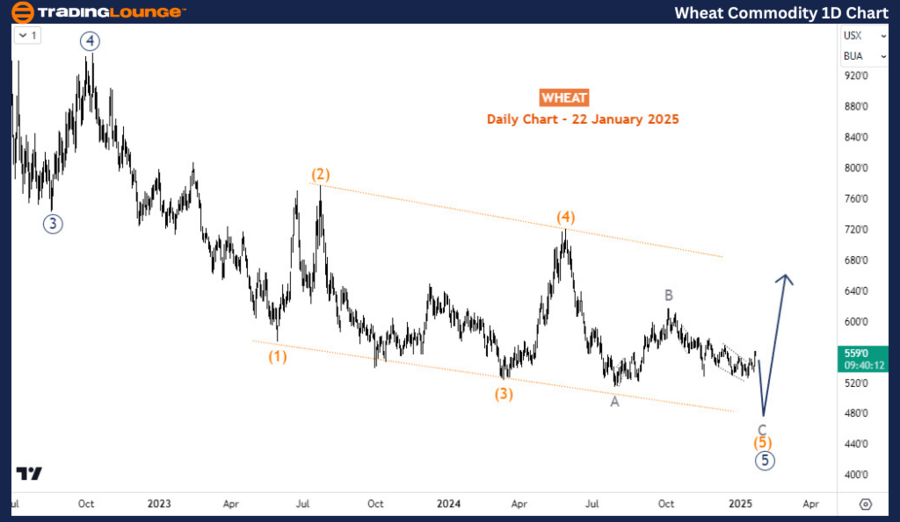
Wheat Commodity Chart Analysis – Daily Chart

On the daily chart, a bearish impulse structure has been forming since March 2022, when wheat traded at $1364. Currently, the price is in the final 5th wave of this bearish impulse, labeled as wave ((5)). Within this wave, the market is unfolding wave (5), developing into a diagonal pattern. As wave (5) nears completion, wheat prices may initiate a long-term bullish correction, potentially lasting several years.

Wheat-Commodity-1D-C...


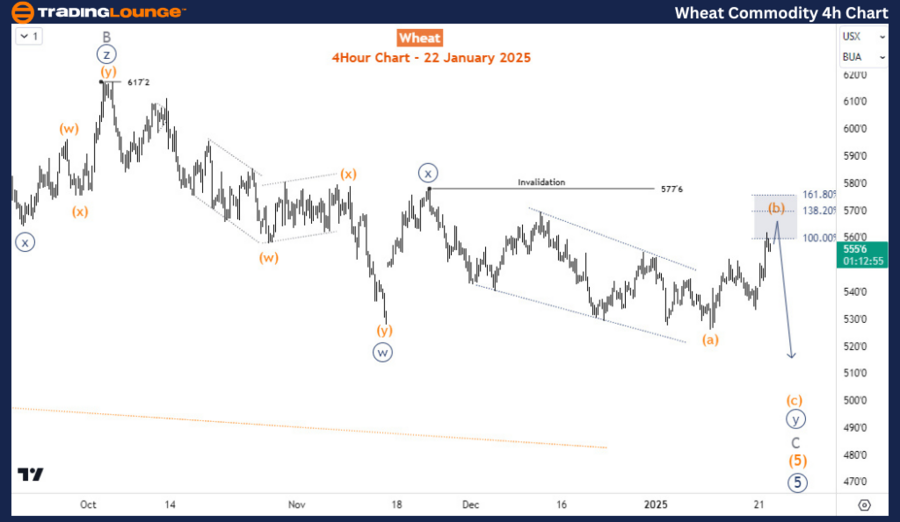
Wheat Commodity Chart Analysis – H4 Chart

The H4 chart analysis reveals that wave (5) is progressing in its final stage, identified as wave C. The ongoing wave C within (5) is shaping into a double zigzag pattern. Presently, the market is experiencing a bounce within wave (b) of ((c)) of C, positioning itself at a crucial Fibonacci resistance zone. If the bounce fails to break above the 577 level, the downward momentum is expected to resume, driving the price lower toward wave (c) of ((y)). This move is likely to complete wave (5) of ((5)), finalizing the bearish cycle initiated in March 2022. Should the expected wave (c) materialize, the price could extend down to 500 or lower.

Technical Analyst: Sanmi Adeagbo

Source: visit Tradinglounge.com and learn From the Experts Join TradingLounge Here 

See Previous: GX URA ETF Elliott Wave Technical Analysis

VALUE Offer - Buy 1 Month & Get 3 Months!Click here

Access 7 Analysts Over 200 Markets Covered. Chat Room With Support

Wheat-Commodity-4h-C...

Related

Saudi Arabian Market is Showing Strong Bullish Trends according to TASI Index Elliott Wave Technical Analysis

Saudi Arabian Market is Showing Strong Bullish Trends according to TASI Index Elliott Wave Technical Analysis

The TASI Index is showing strong bullish trends according to Elliott Wave analysis on both daily and...

Read More >
Cocoa Elliott Wave Technical Analysis: Breaking into New Highs Signals Strong Bullish Momentum

Cocoa Elliott Wave Technical Analysis: Breaking into New Highs Signals Strong Bullish Momentum

Cocoa's price action reflects a strong bullish sentiment, supported by analyses across daily and...

Read More >
NextEra Energy Inc.(NEE) Stocks Elliott Wave Technical Analysis: Covers Stock Predictions, Technical insights, And wave pattern analysis

NextEra Energy Inc.(NEE) Stocks Elliott Wave Technical Analysis: Covers Stock Predictions, Technical insights, And wave pattern analysis

This article provides an in-depth Elliott Wave analysis of NextEra Energy Inc. (NEE) on both daily a...

Read More >
Maruti Suzuki Stocks Elliott Wave Technical Analysis: Understand Maruti Suzuki's Market Trends and Future Stock Levels

Maruti Suzuki Stocks Elliott Wave Technical Analysis: Understand Maruti Suzuki's Market Trends and Future Stock Levels

This article comprehensively analyses Maruti Suzuki's stock using Elliott Wave theory. It covers...

Read More >
Britannia Industries Stock Forecast & Elliott Wave Technical Analysis – Price Targets & Trading Strategies

Britannia Industries Stock Forecast & Elliott Wave Technical Analysis – Price Targets & Trading Strategies

Britannia Industries has shown promising momentum with bullish patterns reflected through Elliott Wa...

Read More >
The Coca-Cola Company (KO:NYSE) Elliott Wave Technical Analysis 16 November 23

The Coca-Cola Company (KO:NYSE) Elliott Wave Technical Analysis 16 November 23

The Coca-Cola Company (KO:NYSE) Elliott Wave Technical Analysis 16 November 23 KO Stock Market Analy...

Read More >

$1 for 2 Weeks

then $29 a month!

What a Special Offer!

Trade Recommendations

Unleash the power of deversified trading with our comprehensive portfolio, covering 250+ markets:

  • Stock Trades
  • Crypto Trades
  • Forex Trades
  • Commodity Trades
Elliott Wave Analysis

Gain a competitive edge with expert insights and AI-powered Elliott Wave charting into:

  • Global Indices
  • US Stocks & ASX Stocks
  • Forex & Crypto
  • Commodities
Top-Notch Trading Tools

Equip yourself with the tools of success:

  • Real-time Chat rooms
  • Elliott Wave Algorithm
  • Portfolio tools
  • TradingLevels
  • Screener
  • Trading Game
7 Elliott Wave Analysts

Stay ahead of the market with daily charts and insightful videos
Your secret to strategic trading!

JOIN HERE


Welcome to TradingLounge (ASIC A.R.No. 321187), specialists in trades, trading education and technical analysis, covering stocks, indices, commodities, forex and cryptocurrencies.

When you join TradingLounge you have access to everything we offer, including trade tools, educational content and a social platform to chat with like-minded investors.

Read more

@Copyright 2024 by tradinglounge.com

Contact Us

Australian no: 02 4787 6020

International no: +61 (2) 47876020

Pay with:

Find us on