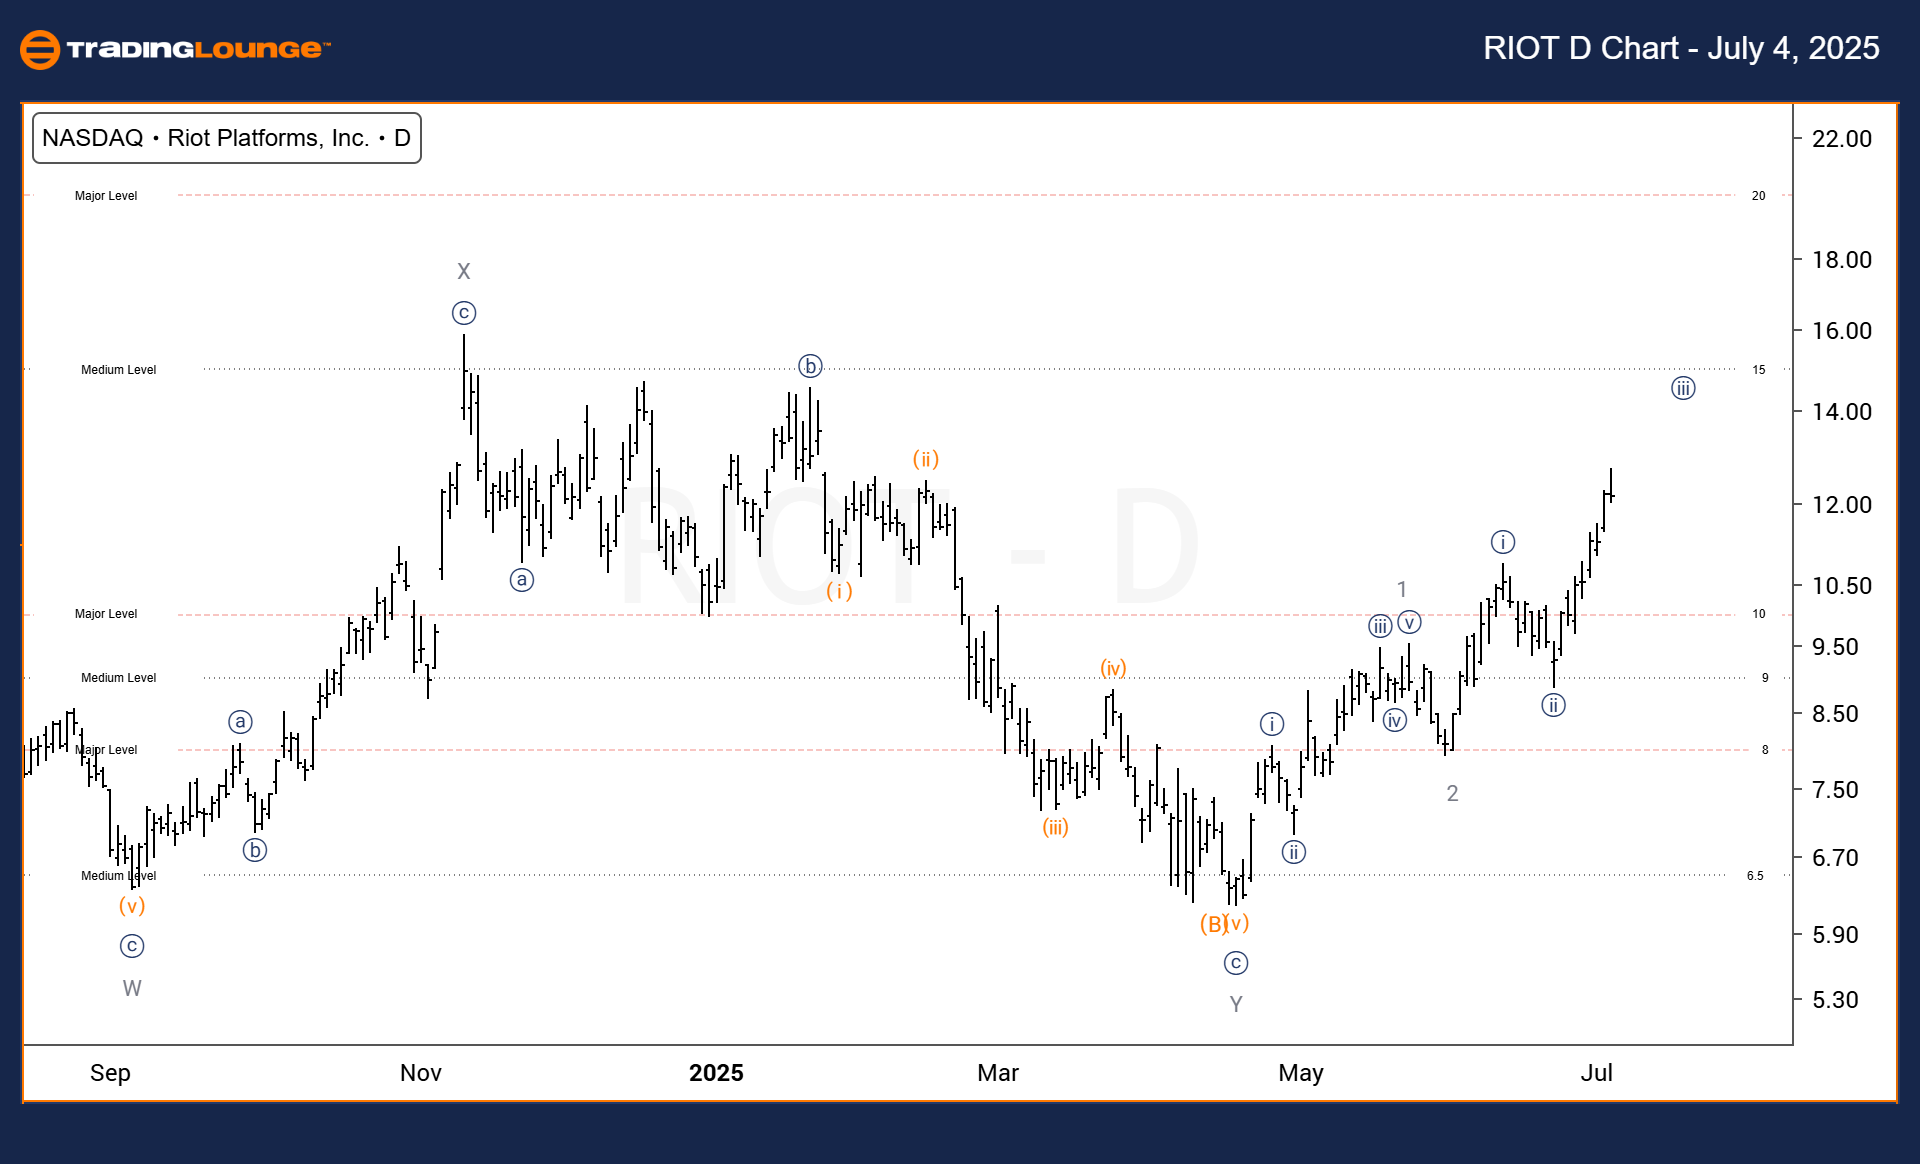
RIOT PLATFORMS, INC. (RIOT) – Elliott Wave Forecast | Daily Chart
RIOT PLATFORMS, INC. (RIOT) Daily Chart Overview – Trading Lounge
RIOT PLATFORMS, INC. (RIOT) Elliott Wave Technical Analysis
Function: Trend
Mode: Impulsive
Structure: Impulsive
Position: Wave {iii} of 3
Direction: Bullish movement toward Wave {iii}
Details: Anticipating a powerful rally as Wave {iii} of 3 unfolds.
Riot Platforms, Inc. (RIOT) continues its upward trend on the daily chart, progressing within Wave {iii} of the third Elliott wave. The stock shows potential for a significant breakout, possibly surpassing previous resistance zones. As Wave {iii} typically extends the farthest in an impulsive wave structure, the price may aim for the 161.8% Fibonacci extension of Wave {i}. This structure supports a bullish short-term outlook, making it attractive for momentum-focused traders tracking Elliott Wave patterns.
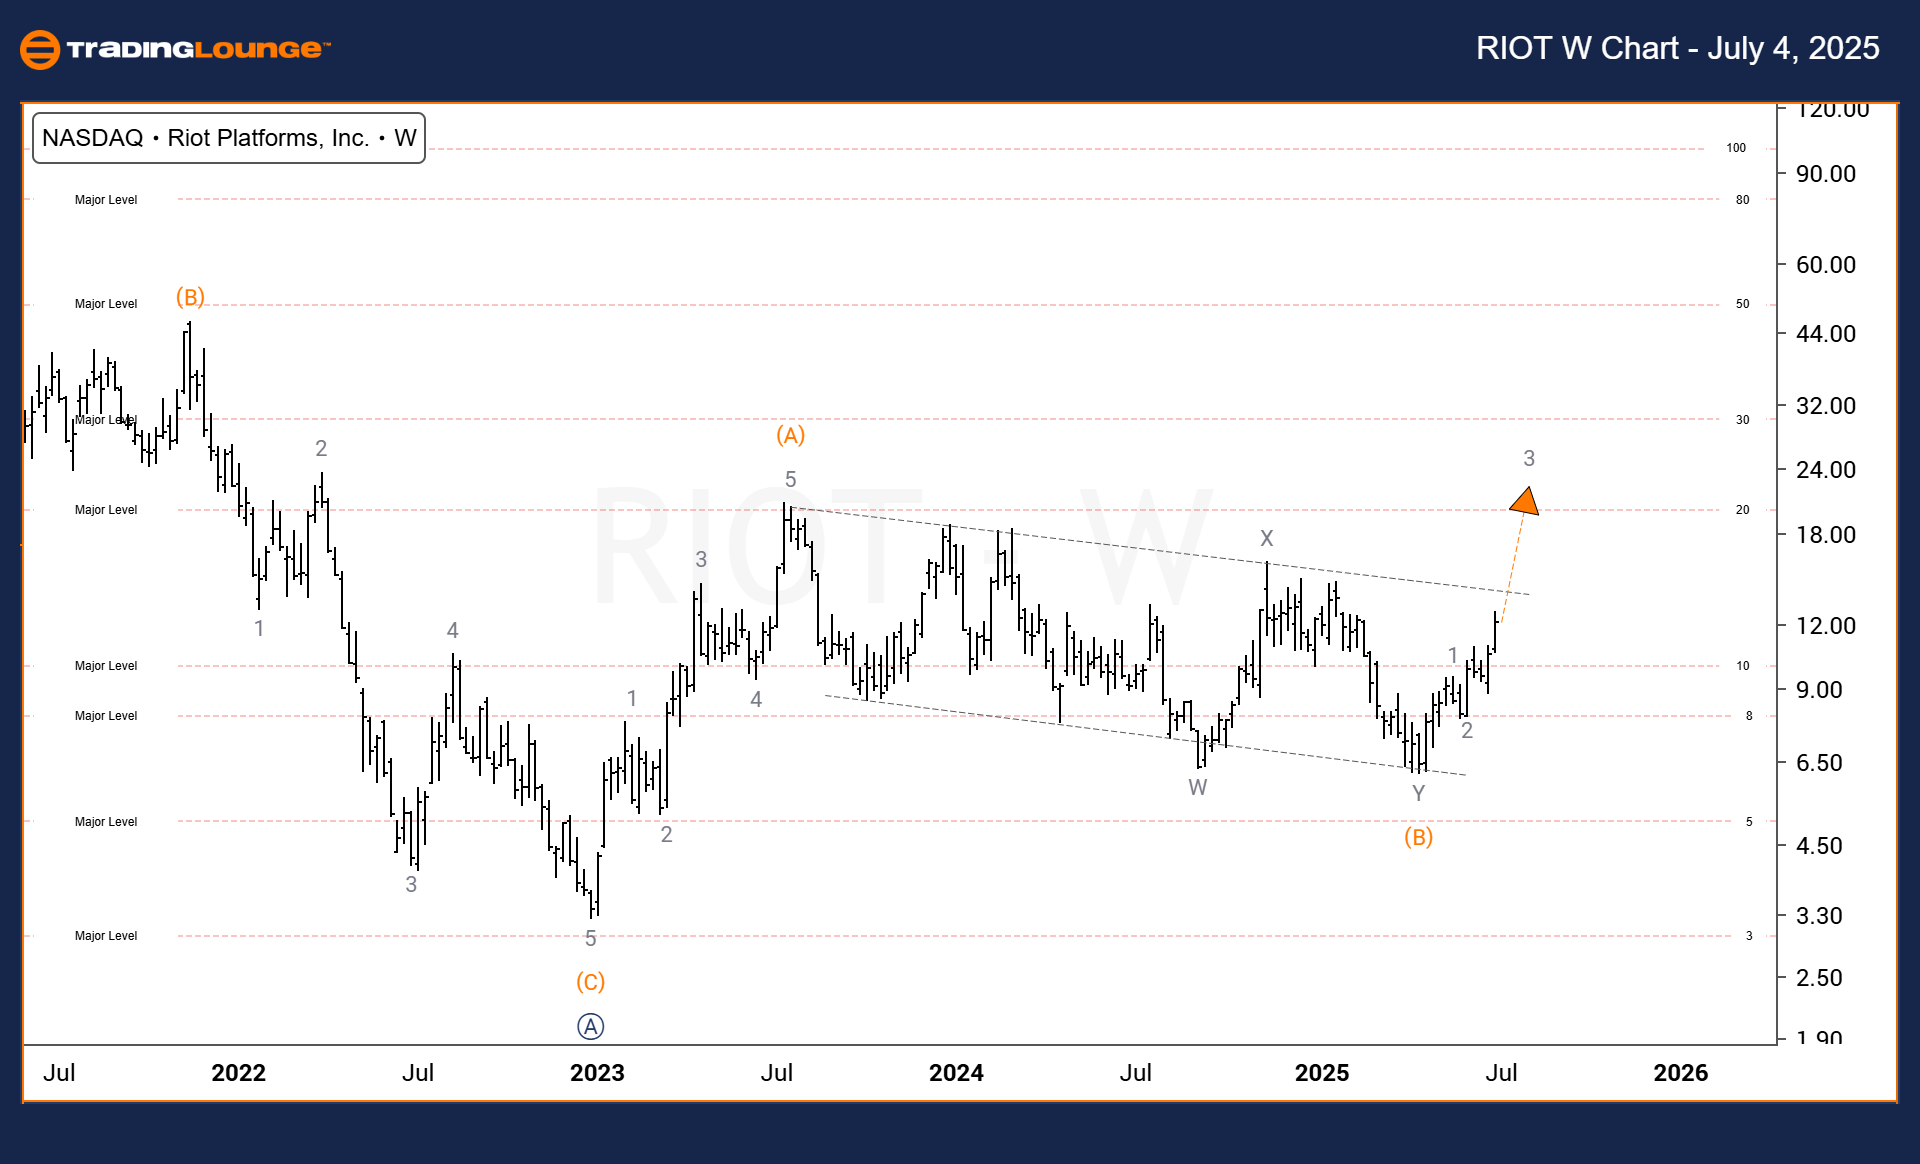
RIOT PLATFORMS, INC. (RIOT) – Elliott Wave Forecast | Weekly Chart
RIOT PLATFORMS, INC. Weekly Chart Technical Overview – Trading Lounge
Function: Trend
Mode: Corrective
Structure: Impulsive
Position: Wave 3 of (C)
Direction: Continued upward move toward Wave 3
Details: After a breakout above the channel, targeting Wave 3 of (C).
On the weekly chart, Riot Platforms, Inc. (RIOT) is forming a broader corrective wave structure, advancing within Wave 3 of (C). The breakout from the prior parallel channel has brought the price near the 100% extension level of Wave (A), representing a critical resistance zone. This area could induce a short-term peak or price consolidation. While the long-term trend remains bullish, traders should be cautious near this resistance and prepare for possible retracements before the next impulsive wave begins.
Technical Analyst: Dhiren Pahuja
Visit: TradingLounge.com for detailed analysis and market updates.
Previous: MARA Holdings, Inc Elliott Wave Technical Analysis
VALUE Offer - $1 for 2 Weeks then $29 a month!Click here
Access 7 Analysts Over 200 Markets Covered. Chat Room With Support