In this SEO-optimized Elliott Wave analysis, we examine the trend structure of The Coca-Cola Company (KO) using daily and 1-hour charts to analyze the current wave position and forecast potential price movements.
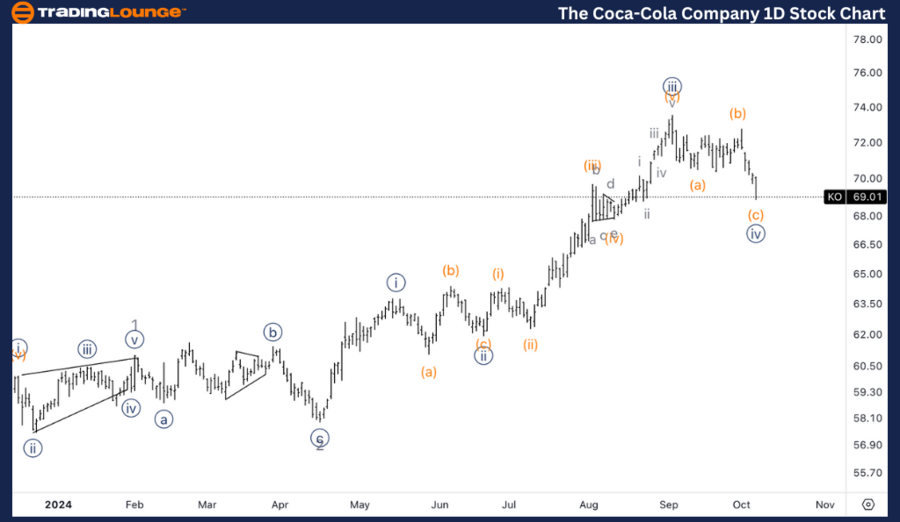
KO Elliott Wave Analysis - Trading Lounge Daily Chart
The Coca-Cola Company (KO) Daily Chart Analysis
KO Elliott Wave Technical Analysis
Function: Trend
Mode: Impulsive
Structure: Motive
Position: Wave 3
Direction: Upside in wave 3
Details: We're expecting a correction in wave {iv} to be near completion, after which the uptrend should resume, potentially pushing KO to complete the higher-degree wave 3 at $80.
KO Technical Analysis – Daily Chart
On the daily chart, Coca-Cola (KO) is in wave 3 of a broader impulsive pattern. A corrective phase within wave {iv} is anticipated to end soon. Once this correction concludes, the stock is likely to resume its upward movement, targeting around $80, which would complete the larger-degree wave 3.

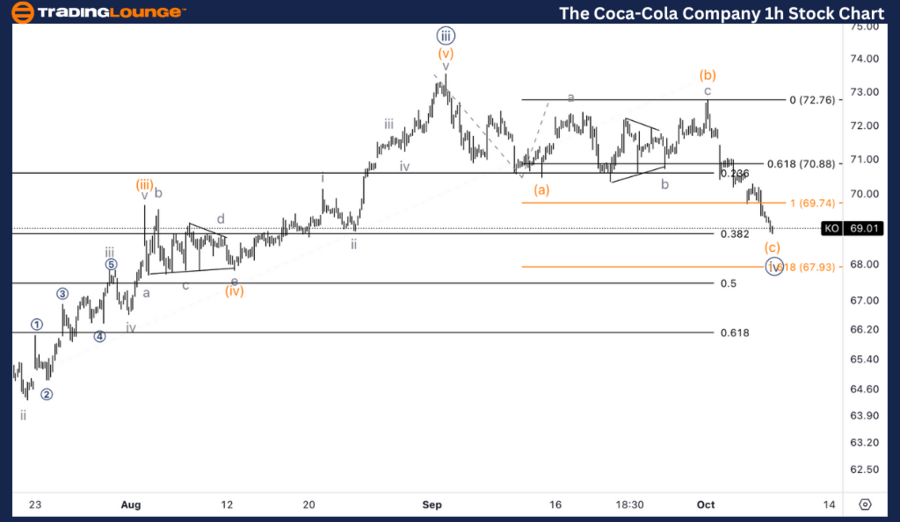
The Coca-Cola Company (KO) 1-Hour Chart
KO Elliott Wave Technical Analysis
Function: Counter Trend
Mode: Corrective
Structure: Flat
Position: Wave (c) of {iv}
Direction: Bottom in wave (c)
Details: A potential bottom in wave (c) is being monitored, as the wave has reached equality between wave (c) and wave (a), alongside a 38.2% retracement of the prior advance in wave {iii}.
KO Elliott Wave Technical Analysis – 1-Hour Chart
On the 1-hour chart, KO is experiencing a flat correction within wave (c) of {iv}. The wave (c) is nearing its potential bottom, with equality between wave (c) and wave (a) and a retracement of 38.2% of the previous advance in wave {iii} suggesting a possible turning point.
Technical Analyst: Alessio Barretta
Source: visit Tradinglounge.com and learn From the Experts Join TradingLounge Here
See Previous: Mastercard Inc. (MA) Elliott Wave Technical Analysis
VALUE Offer - Buy 1 Month & Get 3 Months!Click here
Access 7 Analysts Over 200 Markets Covered. Chat Room With Support
