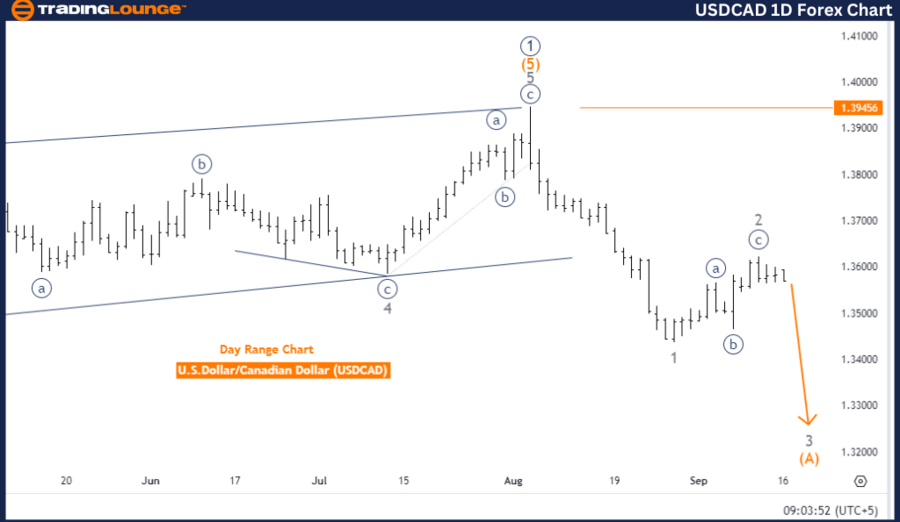
USDCAD Elliott Wave Analysis – Trading Lounge Day Chart
U.S. Dollar / Canadian Dollar (USDCAD) Day Chart Analysis
USDCAD Elliott Wave Technical Analysis
-
Function: Trend
-
Mode: Impulsive
-
Structure: Gray Wave 3
-
Direction Next Lower Degrees: Gray Wave 3 (initiated)
-
Details: Gray wave 2 appears completed, and gray wave 3 is now in progress.
- Wave Cancel Invalid Level: 1.39456
The USDCAD Elliott Wave analysis of the daily chart reveals that the pair is currently in an impulsive trend mode, indicating strong price action. The focus is on gray wave 3, which is part of an impulsive wave sequence often seen during market trends. With gray wave 2 presumed completed, gray wave 3 has started.
Gray wave 3 typically signifies the most extended and dynamic phase of the Elliott Wave cycle, marking a powerful continuation in the market's prevailing trend. This wave usually follows a corrective phase, suggesting that the market is primed for a more forceful move in the direction of the trend, either upward or downward. As gray wave 3 has already begun, USDCAD is expected to experience strong price movement consistent with the current trend.
Additionally, both the higher and lower degrees are moving in tandem within gray wave 3, indicating alignment across multiple time frames. This synchronization enhances the probability that the trend will continue.
An invalidation level is placed at 1.39456. If the price drops below this point, the current wave structure would be invalid, leading to a potential reassessment of the wave count and adjustments to the trading strategy.
Summary: USDCAD is currently in gray wave 3 of an impulsive trend on the daily chart. The trend is expected to continue robustly, with the invalidation level set at 1.39456. A break below this level would require reevaluation of the wave count.
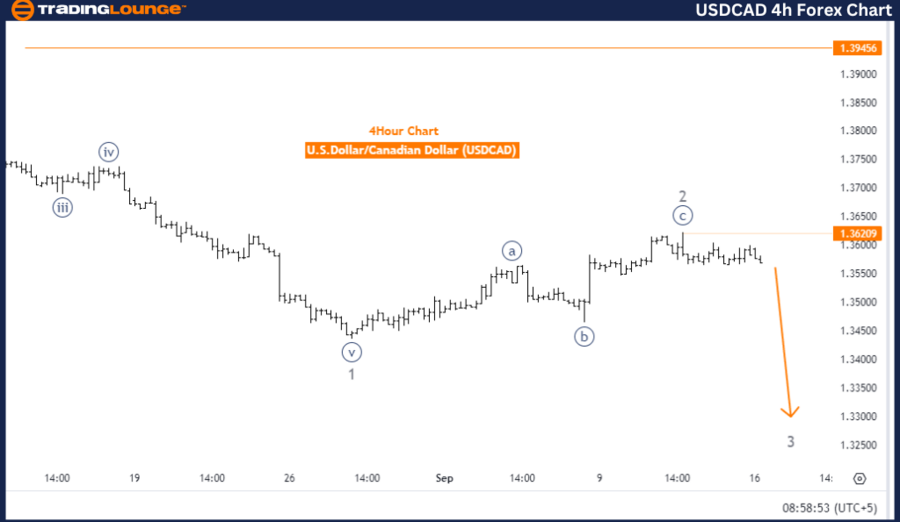
U.S. Dollar / Canadian Dollar (USDCAD) 4-Hour Chart
USDCAD Currency Pair Technical Analysis
-
Function: Trend
-
Mode: Impulsive
-
Structure: Gray Wave 3
-
Direction Next Lower Degrees: Gray Wave 3 (initiated)
-
Details: Gray wave 2 appears completed, and gray wave 3 is now in progress.
- Wave Cancel Invalid Level: 1.39456
The Elliott Wave analysis of the USDCAD 4-hour chart shows that the market is in an impulsive mode, signifying a strong continuation of the trend. The wave structure currently being tracked is gray wave 3, which signals the start of an aggressive price move. With gray wave 2 now completed, the market has exited the corrective phase and is advancing into gray wave 3.
Gray wave 3 is noted for its sharp and rapid movements, typically representing the strongest part of the Elliott Wave cycle. This wave indicates that USDCAD is in a strong trend, whether moving upward or downward, depending on the broader market trend.
The analysis confirms that gray wave 3 has already begun, indicating the impulsive nature of the market’s current condition. Traders should anticipate further price acceleration in the direction of the trend during this phase. The lower degree wave is also in gray wave 3, reinforcing the strength of the ongoing trend.
The invalidation level for this wave is set at 1.39456. If the price falls below this level, the current wave structure would become invalid, possibly indicating a trend reversal or the need to reassess the wave count.
Summary: USDCAD is in the impulsive phase of gray wave 3, following the completion of gray wave 2. The market is expected to maintain its strong trend, with the invalidation level set at 1.39456. If the price falls below this level, the current Elliott Wave analysis may no longer hold.
Technical Analyst: Malik Awais
Source: visit Tradinglounge.com and learn From the Experts Join TradingLounge Here
Previous: EURUSD Elliott Wave Technical Analysis
Special Trial Offer - 0.76 Cents a Day for 3 Months! Click here
Access 7 Analysts Over 200 Markets Covered. Chat Room With Support