03Jun

Shanghai Composite Elliott Wave Forecast: Navigating Wave 3 Breakout with Strategic Technical Analysis for China Stock Market

Shanghai Composite Elliott Wave Analysis | Trading Lounge Day Chart

Shanghai Composite Day Chart Analysis

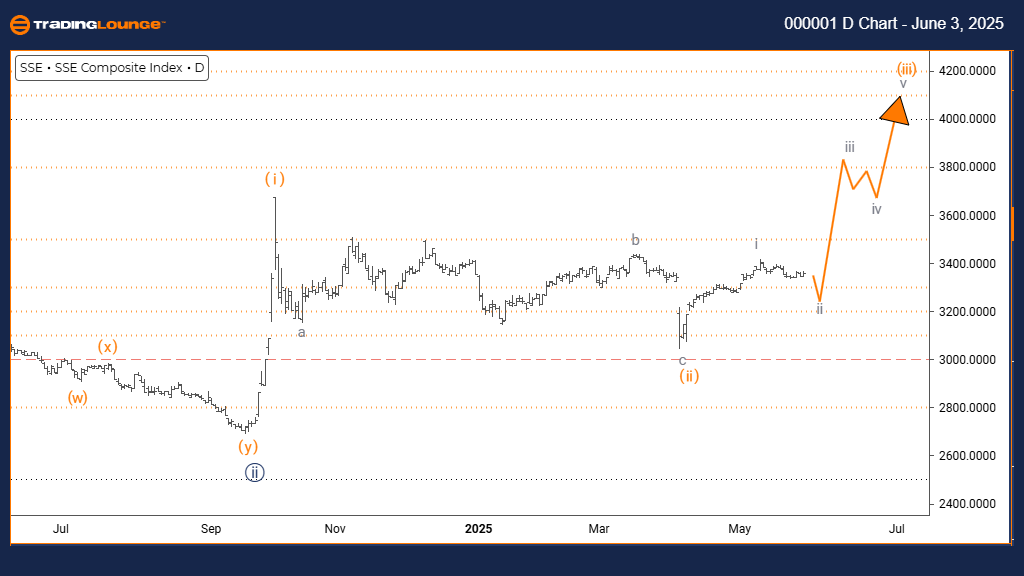
Shanghai Composite Wave Technical Analysis – Daily Time Frame

Function: Counter-Trend Movement

Mode: Corrective Phase

Structure: Developing Gray Wave 2

Current Position: Within Orange Wave 3

Next Degree Direction: Advancing Toward Gray Wave 3

Details: Gray Wave 1 completed; Gray Wave 2 in progress

The daily Elliott Wave analysis for the Shanghai Composite Index shows a corrective pullback within a broader bullish market trend. Currently, the index is forming gray wave 2, part of a larger orange wave 3 advance. The conclusion of gray wave 1 signals the start of a short-term correction, typically followed by a bullish continuation.

With gray wave 2 underway, the market is experiencing moderate downside movement, assuming support levels stay intact. The overarching structure still leans bullish, with the anticipated formation of gray wave 3. This provides traders with a clear view of the ongoing Elliott Wave phase and market positioning.

Present conditions suggest temporary volatility as gray wave 2 unfolds, seen as a pause within an uptrend. Traders should watch for technical signals indicating the completion of this wave, as this would set the stage for a strong rally in wave 3. The wave setup underscores a corrective dip rather than a trend reversal.

It is important for market participants to stay vigilant for emerging patterns, manage risk effectively, and interpret the decline as part of a larger bullish trend—not the start of a bearish cycle.

Shanghai-Composite-I...


Shanghai Composite Elliott Wave Analysis | Trading Lounge Weekly Chart

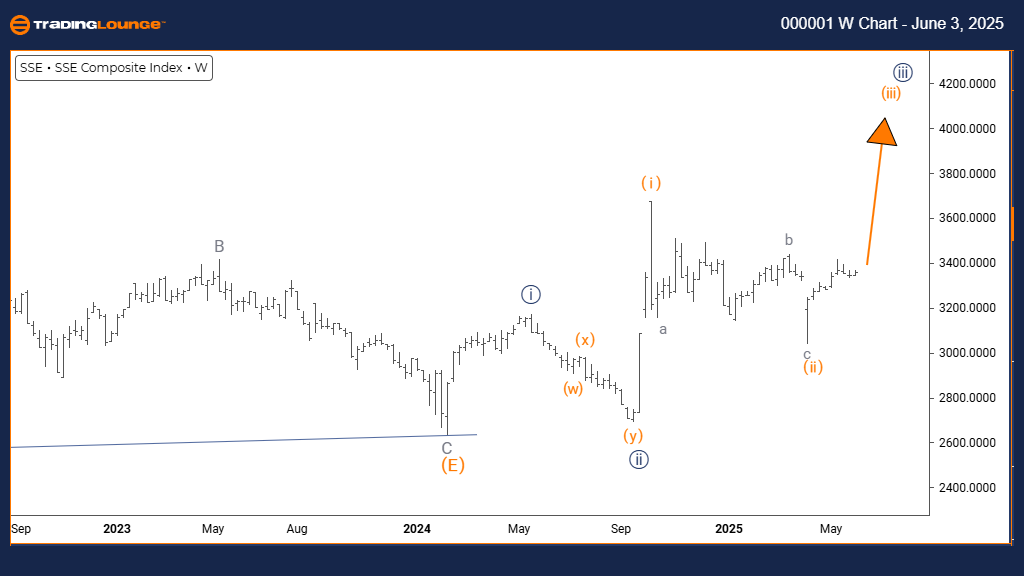
Shanghai Composite Wave Technical Analysis – Weekly Time Frame

Function: Primary Bullish Trend

Mode: Impulsive Wave

Structure: Active Orange Wave 3

Current Position: Inside Navy Blue Wave 3

Next Degree Direction: Orange Wave 3 progression

Details: Orange Wave 2 complete; Orange Wave 3 currently forming

The weekly Elliott Wave analysis of the Shanghai Composite Index presents a bullish impulsive trend, reflecting strong market momentum. The development of orange wave 3 is occurring within navy blue wave 3, suggesting that the corrective orange wave 2 has finalized, and a powerful upward phase is now active.

This wave progression marks the start of a robust impulse wave, typically characterized by aggressive price increases. On a weekly basis, this bullish structure may persist over a longer timeframe, aligning with long-term upward potential. It gives investors a strategic edge in understanding the ongoing wave cycle.

Current trends highlight favorable conditions for trend-following traders, as orange wave 3 often produces significant price gains. Traders should observe the chart for continuation patterns and apply careful risk control to benefit from sustained upside momentum.

This broader market outlook confirms that the Shanghai Composite remains in a strong bullish phase. Within navy blue wave 3, the index is expected to maintain its uptrend before any substantial correction appears. Investors are advised to align entries with the existing wave count for optimized trading positions.

Technical Analyst: Malik Awais

Source: Visit Tradinglounge.com and learn from the Experts. Join TradingLounge Here 

Previous: Russell 2000 Index Elliott Wave Technical Analysis

VALUE Offer - Buy 1 Month & Get 3 Months!Click here

Access 7 Analysts Over 200 Markets Covered. Chat Room With Support

Shanghai-Composite-I...

Related

KOSPI Composite Index Elliott Wave Technical Analysis: Understanding market behaviour and effective trading strategies

KOSPI Composite Index Elliott Wave Technical Analysis: Understanding market behaviour and effective trading strategies

The KOSPI Composite analysis provides insights using Elliott Wave Theory, detailing both day and wee...

Read More >
Elliott Wave Technical Analysis for State Bank of India (SBI) Stock: Predicting Future Price Movements and Key Trading Levels

Elliott Wave Technical Analysis for State Bank of India (SBI) Stock: Predicting Future Price Movements and Key Trading Levels

This article provides a comprehensive Elliott Wave analysis of State Bank of India (SBI) stock. It c...

Read More >
DOW JONES – DJI Index Elliott Wave Forecast Shows Bullish Trend with Wave Count Analysis and Key Invalidation Level at 36,642

DOW JONES – DJI Index Elliott Wave Forecast Shows Bullish Trend with Wave Count Analysis and Key Invalidation Level at 36,642

Dow Jones analysis applies Elliott Wave Theory to identify a strong bullish trend, with active impul...

Read More >
Walmart Inc. Stock Technical Forecast Using Elliott Wave: Bullish Wave (iii) Setup Validates Breakout Potential in WMT Price Chart

Walmart Inc. Stock Technical Forecast Using Elliott Wave: Bullish Wave (iii) Setup Validates Breakout Potential in WMT Price Chart

This analysis explores Walmart's (WMT) bullish outlook using Elliott Wave theory, identifying a ...

Read More >
Currency Pair Australian Dollar and Japanese Yen (AUDJPY) Elliott Wave Technical Analysis and Forex Signals

Currency Pair Australian Dollar and Japanese Yen (AUDJPY) Elliott Wave Technical Analysis and Forex Signals

Our comprehensive AUDJPY Elliott Wave analysis provides valuable insights into market trends, correc...

Read More >
Dogecoin Crypto Price News Today - Elliott Wave Analysis of Dogecoin/USD (DOGEUSD) A Comprehensive Guide

Dogecoin Crypto Price News Today - Elliott Wave Analysis of Dogecoin/USD (DOGEUSD) A Comprehensive Guide

This article offers a comprehensive look at the Dogecoin (DOGEUSD) market through the lens of Elliot...

Read More >

$1 for 2 Weeks

then $29 a month!

What a Special Offer!

Trade Recommendations

Unleash the power of deversified trading with our comprehensive portfolio, covering 250+ markets:

  • Stock Trades
  • Crypto Trades
  • Forex Trades
  • Commodity Trades
Elliott Wave Analysis

Gain a competitive edge with expert insights and AI-powered Elliott Wave charting into:

  • Global Indices
  • US Stocks & ASX Stocks
  • Forex & Crypto
  • Commodities
Top-Notch Trading Tools

Equip yourself with the tools of success:

  • Real-time Chat rooms
  • Elliott Wave Algorithm
  • Portfolio tools
  • TradingLevels
  • Screener
  • Trading Game
7 Elliott Wave Analysts

Stay ahead of the market with daily charts and insightful videos
Your secret to strategic trading!

JOIN HERE


Welcome to TradingLounge (ASIC A.R.No. 321187), specialists in trades, trading education and technical analysis, covering stocks, indices, commodities, forex and cryptocurrencies.

When you join TradingLounge you have access to everything we offer, including trade tools, educational content and a social platform to chat with like-minded investors.

Read more

@Copyright 2024 by tradinglounge.com

Contact Us

Australian no: 02 4787 6020

International no: +61 (2) 47876020

Pay with:

Find us on