02Jun

Russell 2000 Index Elliott Wave Analysis Shows Strong Bullish Trend Setup with Indicating Early Momentum in a Long-term Upward Trend

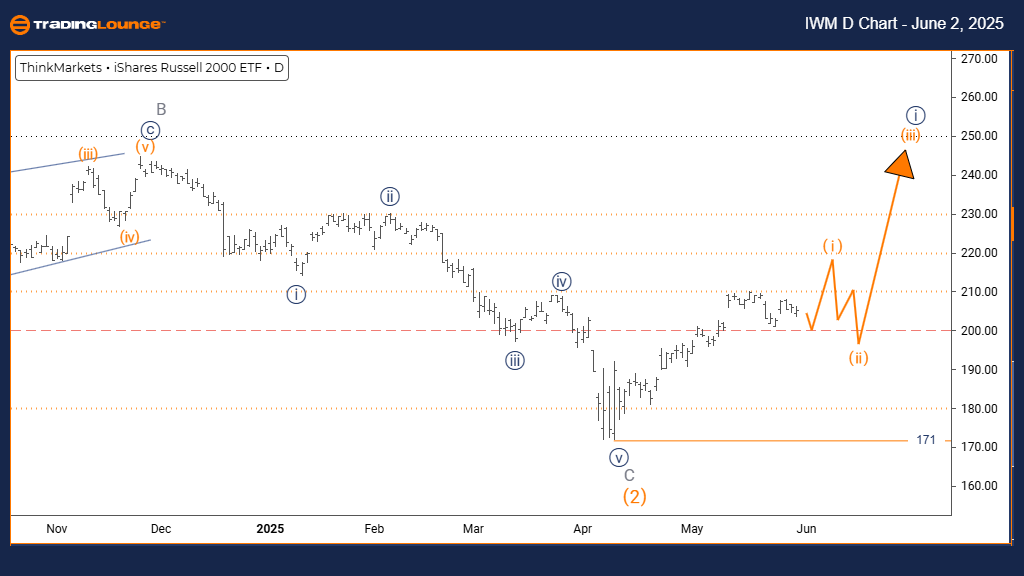
Russell 2000 Elliott Wave Analysis – Trading Lounge Day Chart

Russell 2000 Index Day Chart Analysis

Russell 2000 Elliott Wave Technical Overview

Function: Bullish Trend

Mode: Impulsive

Structure: Orange Wave 1

Position: Navy Blue Wave 1

Next Lower Degree Direction: Orange Wave 2

Details: Orange Wave 1 is progressing within Navy Blue Wave 1, indicating early momentum in a broader uptrend. Invalidation level: 171

Current Chart Outlook

The Russell 2000 Index is displaying a clear bullish setup on the daily chart, as Orange Wave 1 forms the initial leg of Navy Blue Wave 1. This wave pattern points to the early phase of a larger bullish cycle. Price action suggests strong buyer interest, reinforcing the upward structure.

Market Dynamics and Risk Factors

The impulsive wave behavior highlights sustained buying activity. The critical support sits at 171; staying above this level keeps the bullish count valid. A break below would question the ongoing wave structure and possibly signal either a more complex correction or a count revision.

Forecast and Strategic Insights

As the Orange Wave 1 continues, further gains are expected. Once completed, a pullback in Orange Wave 2 is anticipated. Short-term strategies should focus on capturing upside momentum while preparing for a corrective move. Risk management remains essential during this formative stage of the trend.

Russell-2000-Index-i...


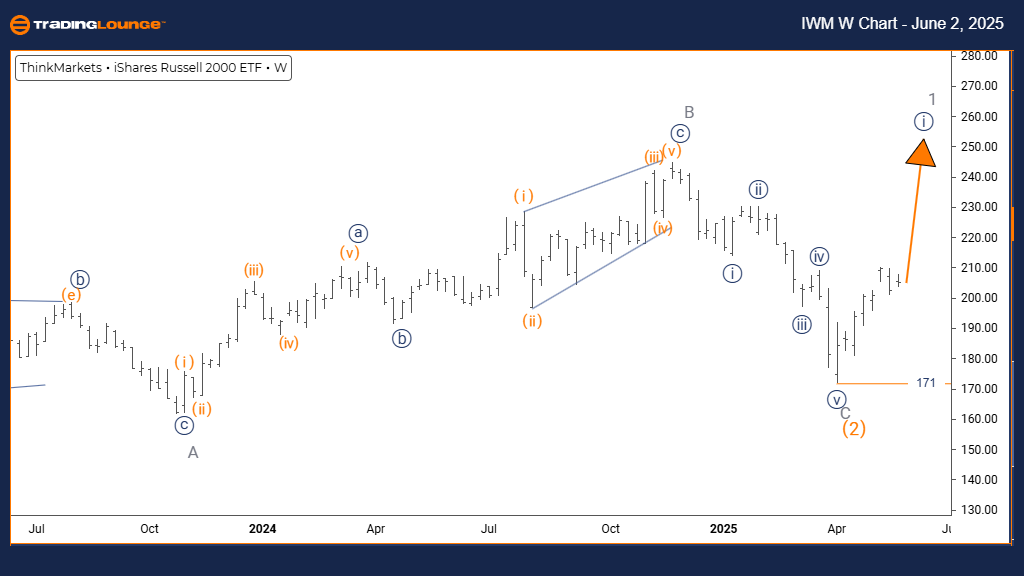
Russell 2000 Elliott Wave Analysis – Trading Lounge Weekly Chart

Russell 2000 Elliott Wave Technical Overview

Function: Bullish Trend

Mode: Impulsive

Structure: Navy Blue Wave 1

Position: Gray Wave 1

Next Lower Degree Direction: Navy Blue Wave 2

Details: Completion of Orange Wave 2 has led into Navy Blue Wave 1. Invalidation level: 171

Long-Term Market View

The weekly chart of the Russell 2000 Index reveals a breakout structure. Navy Blue Wave 1 is progressing within the broader Gray Wave 1. With Orange Wave 2 confirmed as complete, the chart indicates the start of a sustained bullish phase.

Investor Implications

The impulsive structure signals strong bullish conviction. As long as the index holds above the 171 support level, the bullish wave structure remains intact. A break below this would require reassessment of the wave count and underlying trend.

Strategic Takeaways for Investors

This evolving pattern suggests that the Russell 2000 is in the initial stages of a multi-leg uptrend. As Navy Blue Wave 1 continues to develop, the next likely phase is a retracement via Navy Blue Wave 2. Long-term investors should monitor key levels and trend confirmation signals for optimal entry and risk management.

Technical Analyst: Malik Awais

Source: Visit Tradinglounge.com and learn from the Experts. Join TradingLounge Here 

Previous: S&P/TSX 60 index Elliott Wave Technical Analysis

VALUE Offer - Buy 1 Month & Get 3 Months!Click here

Access 7 Analysts Over 200 Markets Covered. Chat Room With Support

Russell-2000-Index-i...

Related

Insights to Support Informed Trading Decisions: British Pound/U.S. Dollar (GBPUSD) Forex Elliott Wave Technical Analysis

Insights to Support Informed Trading Decisions: British Pound/U.S. Dollar (GBPUSD) Forex Elliott Wave Technical Analysis

This article provides a thorough Elliott Wave analysis for GBPUSD, covering both daily and 4-hour ch...

Read More >
Caterpillar (CAT) Elliott Wave Analysis: Bullish Stock Forecast with Technical Chart Insights, and Trading Strategy Guide

Caterpillar (CAT) Elliott Wave Analysis: Bullish Stock Forecast with Technical Chart Insights, and Trading Strategy Guide

This analysis provides a comprehensive Elliott Wave breakdown of Caterpillar Inc. (CAT), highlightin...

Read More >
WESTPAC BANKING CORPORATION- Learn how to leverage these WBC Stock Analysis & Elliott Wave Technical Forecast

WESTPAC BANKING CORPORATION- Learn how to leverage these WBC Stock Analysis & Elliott Wave Technical Forecast

Explore the comprehensive Elliott Wave analysis for ASX: WESTPAC BANKING CORPORATION (WBC). Our deta...

Read More >
AMCOR Stock Forecast: ASX AMC Starts Bullish Wave 3 After Corrective Zigzag – Elliott Wave Analysis, Price Targets, Trade Setups

AMCOR Stock Forecast: ASX AMC Starts Bullish Wave 3 After Corrective Zigzag – Elliott Wave Analysis, Price Targets, Trade Setups

AMCOR (ASX: AMC) completes a corrective wave and begins bullish Wave (3). Discover price targets, in...

Read More >
BTCUSD Elliott Wave Analysis: Bitcoin Price Prediction, Key Support at 78,402 USD, Potential V Wave Formation, and 126K USD Target

BTCUSD Elliott Wave Analysis: Bitcoin Price Prediction, Key Support at 78,402 USD, Potential V Wave Formation, and 126K USD Target

BTCUSD has corrected to a critical support level at 78,402 USD, where buyers have stepped in. Based ...

Read More >
Key Phases in the Iron Ore Market and Future Price Predictions using the Iron Ore Commodity Elliott Wave Technical Analysis

Key Phases in the Iron Ore Market and Future Price Predictions using the Iron Ore Commodity Elliott Wave Technical Analysis

Stay informed with our comprehensive iron ore price forecast and Elliott Wave analysis. We cover ess...

Read More >

$1 for 2 Weeks

then $29 a month!

What a Special Offer!

Trade Recommendations

Unleash the power of deversified trading with our comprehensive portfolio, covering 250+ markets:

  • Stock Trades
  • Crypto Trades
  • Forex Trades
  • Commodity Trades
Elliott Wave Analysis

Gain a competitive edge with expert insights and AI-powered Elliott Wave charting into:

  • Global Indices
  • US Stocks & ASX Stocks
  • Forex & Crypto
  • Commodities
Top-Notch Trading Tools

Equip yourself with the tools of success:

  • Real-time Chat rooms
  • Elliott Wave Algorithm
  • Portfolio tools
  • TradingLevels
  • Screener
  • Trading Game
7 Elliott Wave Analysts

Stay ahead of the market with daily charts and insightful videos
Your secret to strategic trading!

JOIN HERE


Welcome to TradingLounge (ASIC A.R.No. 321187), specialists in trades, trading education and technical analysis, covering stocks, indices, commodities, forex and cryptocurrencies.

When you join TradingLounge you have access to everything we offer, including trade tools, educational content and a social platform to chat with like-minded investors.

Read more

@Copyright 2024 by tradinglounge.com

Contact Us

Australian no: 02 4787 6020

International no: +61 (2) 47876020

Pay with:

Find us on