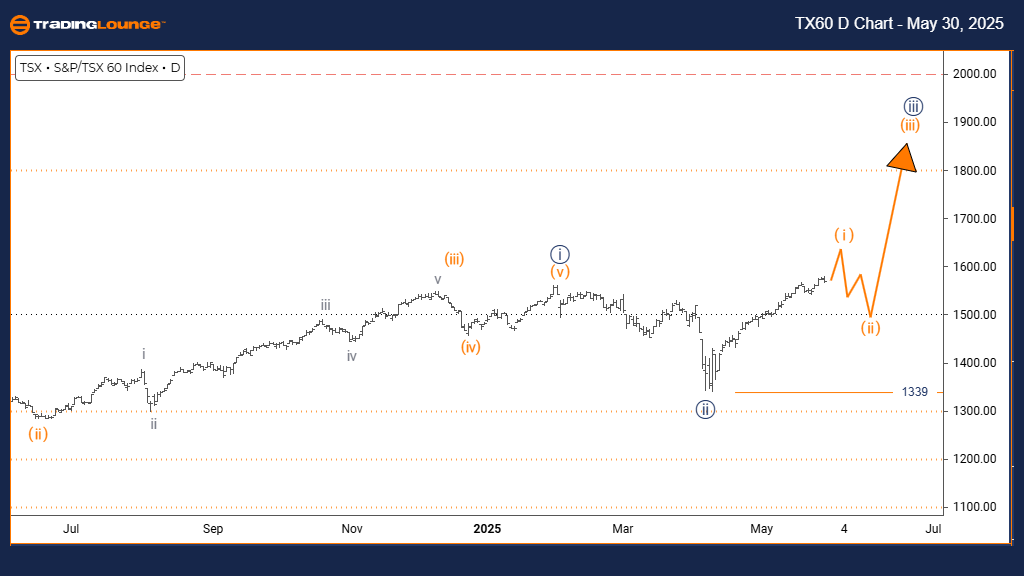
S&P/TSX 60 Elliott Wave Analysis – Trading Lounge Day Chart

S&P/TSX 60 Day Chart Analysis

S&P/TSX 60 Elliott Wave Technical Analysis

FUNCTION: Bullish Trend

MODE: Impulsive

STRUCTURE: Orange Wave 1

POSITION: Navy Blue Wave 3

DIRECTION NEXT LOWER DEGREES: Orange Wave 2

DETAILS: Completion of Navy Blue Wave 2 confirmed; development of Orange Wave 1 of 3 is underway.
Wave cancel/invalidation level: 1339

The daily Elliott Wave outlook for the S&P/TSX 60 Index signals a strong bullish momentum emerging. The structure is unfolding as Orange Wave 1, within the broader Navy Blue Wave 3, confirming the end of Navy Blue Wave 2 and initiating a new upward phase.

This bullish setup points to increased upside potential as Orange Wave 1 gains strength. The confirmation of Navy Blue Wave 2's completion strengthens the impulsive outlook. Traders should note the critical invalidation level at 1339—a break below would challenge the current wave count or imply a deeper correction is forming.

This phase marks an ideal entry for those aligned with the trend. As Orange Wave 2 has not yet commenced, the current structure suggests a high-probability rally. Active traders should stay alert to price action while applying risk controls consistent with wave development.'

TX60-Day-index-Chart...


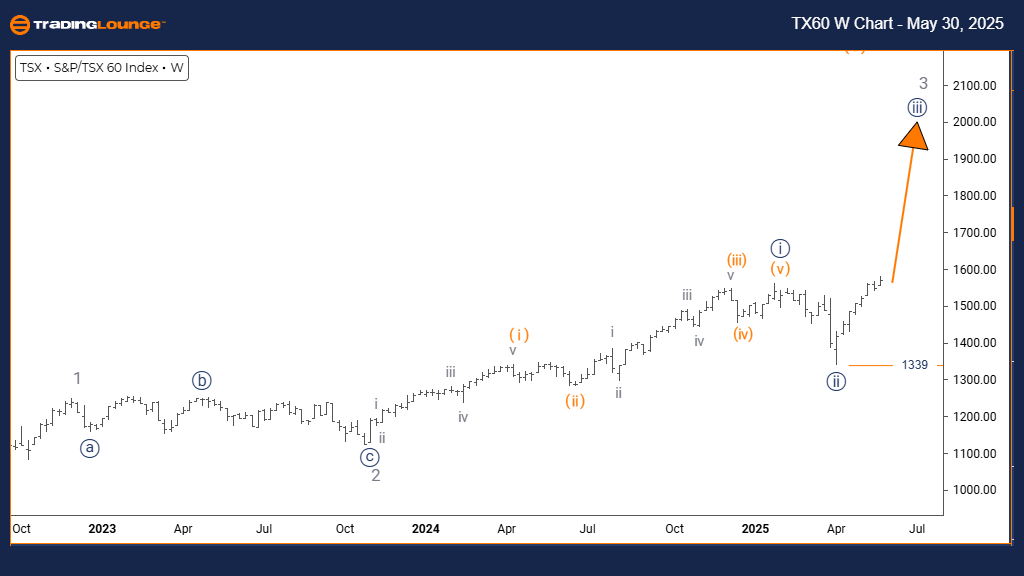
S&P/TSX 60 Elliott Wave Analysis – Trading Lounge Weekly Chart

S&P/TSX 60 Elliott Wave Technical Analysis

FUNCTION: Bullish Trend

MODE: Impulsive

STRUCTURE: Navy Blue Wave 3

POSITION: Gray Wave 3

DIRECTION NEXT LOWER DEGREES: Navy Blue Wave 4

DETAILS: Completion of Navy Blue Wave 2 confirmed; progression into Navy Blue Wave 3 of 3 is active.

Wave cancel/invalidation level: 1339

The weekly Elliott Wave chart of the S&P/TSX 60 Index reinforces a strong bullish trend, driven by the impulsive rise of Navy Blue Wave 3 inside the larger Gray Wave 3. The conclusion of Navy Blue Wave 2 confirms entry into the most aggressive phase of this trend cycle.

This current wave signals institutional accumulation and expanding bullish momentum, hallmarks of a powerful third wave move. Maintaining 1339 as the invalidation level helps clarify risk and safeguard the bullish framework.

This stage is typically the most dynamic in Elliott Wave theory, often delivering strong market gains. As traders and investors prepare for Navy Blue Wave 4, they should adjust positions and implement proper risk management strategies, mindful of the potential volatility as the rally progresses.

Technical Analyst: Malik Awais

Source: Visit Tradinglounge.com and learn from the Experts. Join TradingLounge Here 

Previous: DAX index Elliott Wave Technical Analysis

VALUE Offer - Buy 1 Month & Get 3 Months!Click here

Access 7 Analysts Over 200 Markets Covered. Chat Room With Support

TX60-Weekly-index-Ch...

Related

Comprehensive Stock Market Indices Analysis: S&P 500, NASDAQ 100, RUSSELL 2000, DAX 40, FTSE 100, ASX 200 | Elliott Wave Insights

Comprehensive Stock Market Indices Analysis: S&P 500, NASDAQ 100, RUSSELL 2000, DAX 40, FTSE 100, ASX 200 | Elliott Wave Insights

The S&P 500 and NASDAQ 100 are currently in a bullish Elliott Wave pattern, specifically in wave (ii...

Read More >
CSX Stock Forecast Using Elliott Wave Points to Bullish Trend Continuation With Clear Target of $50 Amid Strong Momentum

CSX Stock Forecast Using Elliott Wave Points to Bullish Trend Continuation With Clear Target of $50 Amid Strong Momentum

Elliott Wave analysis shows CSX in a bullish impulsive phase. Wave 3 formation suggests strength, wi...

Read More >
Comprehensive Corn Price Analysis: Corn Commodity Elliott Wave Forecast and Technical Insights into Current Corn Futures Market Trends

Comprehensive Corn Price Analysis: Corn Commodity Elliott Wave Forecast and Technical Insights into Current Corn Futures Market Trends

This article provides an in-depth analysis of corn prices through the lens of Elliott Wave theory. I...

Read More >
Tech Stock Forecast: AAPL, NVDA, AMZN Lead While TSLA, MSFT, GOOGL Lag...

Tech Stock Forecast: AAPL, NVDA, AMZN Lead While TSLA, MSFT, GOOGL Lag...

The Elliott Wave analysis indicates an upward movement (Wave (ii) of iii)) for the SP500 and NASDAQ ...

Read More >
Power Grid Corp's Stocks Elliott Wave Technical Analysis - Discover Key Price Levels and Future Trends in the Market

Power Grid Corp's Stocks Elliott Wave Technical Analysis - Discover Key Price Levels and Future Trends in the Market

This analysis provides an in-depth look at Power Grid Corp's stock using Elliott Wave theory. Di...

Read More >

Buy 1 Month

Get 3 Months!

Special Offer:

Trade Recommendations

Unleash the power of deversified trading with our comprehensive portfolio, covering:

  • Stock Trades
  • Crypto Trades
  • Forex Trades
  • Commodity Trades
Elliott Wave Analysis

Gain a competive edge with expert insights in to:

  • Global Indices
  • US Stocks & ASX Stocks
  • Forex & Crypto
  • Commodities
Top-Notch Trading Tools

Equip yourself with the tools of success:

  • Social Chat
  • Elliott Wave Algorithm
  • Screener
  • TradingLevels
  • Trading Game
7 Elliott Wave Analysts

Stay ahead of the market with daily charts and insightful videos
-Your secret to strategic trading!

JOIN HERE


Welcome to TradingLounge (ASIC A.R.No. 321187), specialists in trades, trading education and technical analysis, covering stocks, indices, commodities, forex and cryptocurrencies.

When you join TradingLounge you have access to everything we offer, including trade tools, educational content and a social platform to chat with like-minded investors.

Read more

@Copyright 2024 by tradinglounge.com

Contact Us

Australian no: 02 4787 6020

International no: +61 (2) 47876020

Pay with:

Find us on