Theta Token Crypto Price News Today Elliott Wave Technical Analysis

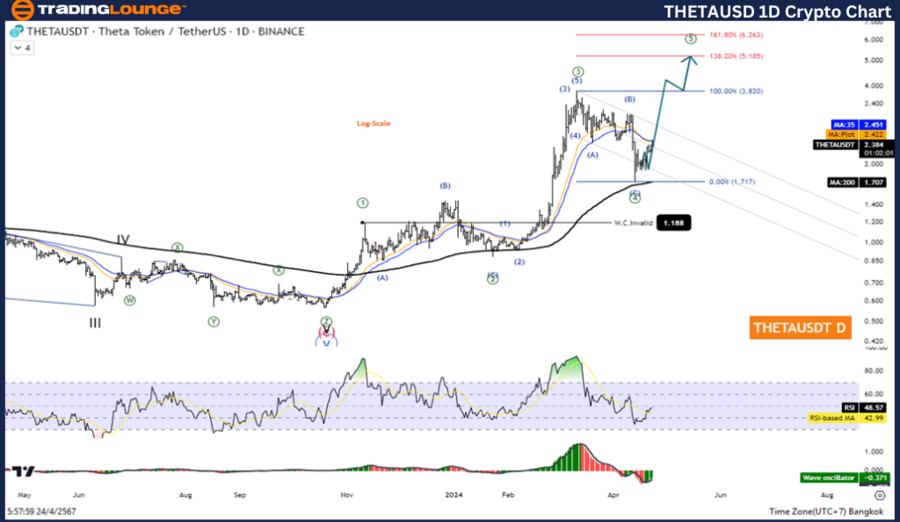
THETAUSD Elliott Wave Technical Analysis: Theta Token vs. U.S. Dollar Pair

Function: Trend Following

Mode: Motive

Structure: Impulse

Position: Wave ((5))

Direction of Next Higher Degrees: Wave I of Impulse

Invalidation Level: Not specified

Analysis: The completion of Wave ((4)) suggests a transition back to an upward trend.

Trading Strategy for THETAUSD

The recent end of the corrective Wave ((4)) indicates a renewed upward momentum, marking the beginning of Wave ((5)). For investors, this signals a potentially lucrative entry point for long positions. Target Price Range: $5.185 to $6.263.

Technical Indicators

The current price of Theta Token surpasses the 200-day Moving Average (MA200), signalling a strong uptrend. Additionally, the Wave Oscillator confirms bullish momentum, further reinforcing the positive outlook for THETAUSD.

THETAUSD-1D-Crypto-c...


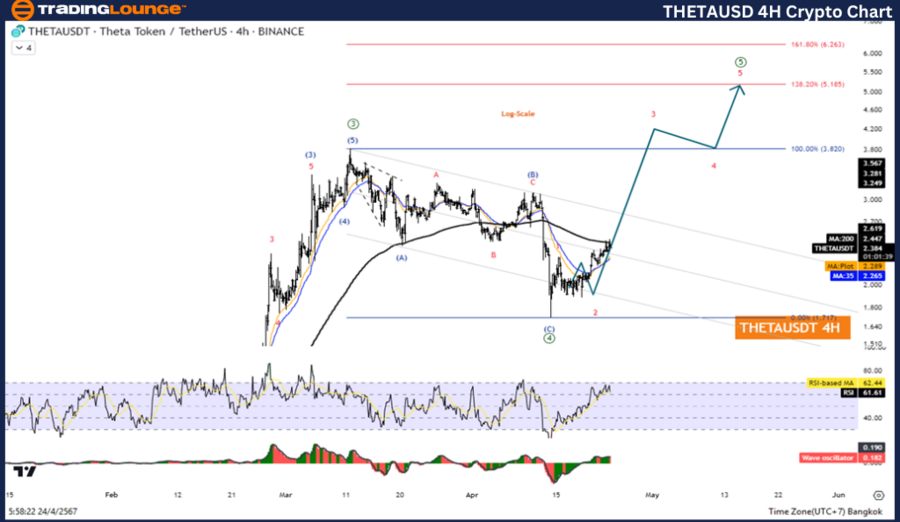
Theta Token vs. U.S. Dollar 4-HOur Chart Analysis

THETAUSD Elliott Wave Technical Review

Function: Trend Following

Mode: Motive

Structure: Impulse

Position: Wave ((5))

Direction of Next Higher Degrees: Wave I of Impulse

Invalidation Level: Not specified

Analysis: Similar to the daily chart, the H4 analysis underscores the shift to a bullish trend as Wave ((4)) concludes and Wave ((5)) commences.

Trading Strategy Overview

With the completion of the correction phase in Wave ((4)) and the price ascending once again, THETAUSD is poised for continued growth. This phase of the cycle presents an excellent opportunity for investors to consider long positions. Target Price Range: $5.185 to $6.263.

Technical Indicators Summary

Consistent with the daily chart’s findings, the THETAUSD remains robust above the MA200. This alignment with a bullish Wave Oscillator reading suggests that the momentum for Theta Token is likely to persist, making it a strong candidate for investment in the current market phase.

Conclusion and Future Outlook

The Elliott Wave analysis for Theta Token/USD demonstrates a strong bullish trend across both daily and H4 charts. The transition from Wave ((4)) to Wave ((5)) highlights a significant opportunity for growth-oriented trading strategies. With technical indicators like the MA200 and the Wave Oscillator reinforcing the positive trend, both short-term and long-term investors may find valuable entry points. It's essential for traders to monitor these waves and consider the potential for new highs in the pricing of Theta Token as it progresses through its motive phases.

Technical Analyst: Kittiampon Somboonsod

Source: visit Tradinglounge.com and learn From the Experts Join TradingLounge Here 

See Previous: Binance/ U.S. dollar(BNBUSD) Elliott Wave Analysis

TradingLounge's Free Week Extravaganza!

April 14 – 21: Unlock the Doors to Trading Excellence — Absolutely FREE

THETAUSD-4hr-Crypto-...

Related

The TJX Companies Inc. (TJX) Stocks Elliott Wave Technical Analysis: Elliott Wave Insights and Predictions

The TJX Companies Inc. (TJX) Stocks Elliott Wave Technical Analysis: Elliott Wave Insights and Predictions

Discover an in-depth TJX stock analysis through Elliott Wave Theory, examining both daily and 4-hour...

Read More >
Maximize Your NASDAQ Trading Strategies with Elliott Wave Analysis

Maximize Your NASDAQ Trading Strategies with Elliott Wave Analysis

Leverage Elliott Wave Analysis for strategic trading in the NASDAQ stock market, focusing on key tec...

Read More >
U.S.Dollar/Japanese Yen(USDJPY) Forex - Elliottwave Technical analysis

U.S.Dollar/Japanese Yen(USDJPY) Forex - Elliottwave Technical analysis

Elliott Wave analysis of the USDJPY currency pair, providing traders with a detailed forecast and in...

Read More >
PaloAlto Networks Inc. stock price towards key levels: PANW Elliott Wave Technical Analysis and Potential Upside

PaloAlto Networks Inc. stock price towards key levels: PANW Elliott Wave Technical Analysis and Potential Upside

This detailed analysis of Palo Alto Networks (PANW) stock uses Elliott Wave Theory to explore the cu...

Read More >
Offers valuable insights into Spotify Technology S.A., (SPOT) Stocks Elliott Wave Technical Analysis

Offers valuable insights into Spotify Technology S.A., (SPOT) Stocks Elliott Wave Technical Analysis

Our detailed SPOT Elliott Wave analysis offers valuable insights into Spotify Technology S.A. stock....

Read More >
Ripple (XRP) Crypto Price News Today and XRPUSD Elliott Wave Technical Analysis: XRP Price Forecast and Trading Strategy

Ripple (XRP) Crypto Price News Today and XRPUSD Elliott Wave Technical Analysis: XRP Price Forecast and Trading Strategy

XRPUSD is completing a Wave 2 A-B-C correction. Watch for bullish signals around $1.90–$1.88 to ent...

Read More >

$1 for 2 Weeks

then $29 a month!

What a Special Offer!

Trade Recommendations

Unleash the power of deversified trading with our comprehensive portfolio, covering 250+ markets:

  • Stock Trades
  • Crypto Trades
  • Forex Trades
  • Commodity Trades
Elliott Wave Analysis

Gain a competitive edge with expert insights and AI-powered Elliott Wave charting into:

  • Global Indices
  • US Stocks & ASX Stocks
  • Forex & Crypto
  • Commodities
Top-Notch Trading Tools

Equip yourself with the tools of success:

  • Real-time Chat rooms
  • Elliott Wave Algorithm
  • Portfolio tools
  • TradingLevels
  • Screener
  • Trading Game
7 Elliott Wave Analysts

Stay ahead of the market with daily charts and insightful videos
Your secret to strategic trading!

JOIN HERE


Welcome to TradingLounge (ASIC A.R.No. 321187), specialists in trades, trading education and technical analysis, covering stocks, indices, commodities, forex and cryptocurrencies.

When you join TradingLounge you have access to everything we offer, including trade tools, educational content and a social platform to chat with like-minded investors.

Read more

@Copyright 2024 by tradinglounge.com

Contact Us

Australian no: 02 4787 6020

International no: +61 (2) 47876020

Pay with:

Find us on