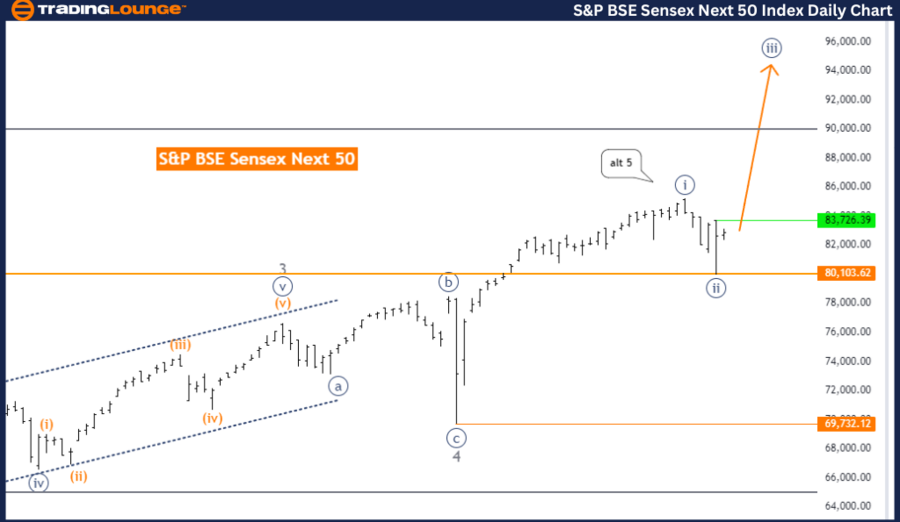
TradingLounge Index S&P BSE Sensex (India) Elliott Wave Analysis - Daily Chart
S&P BSE Sensex (India) Elliott Wave Analysis - Day Chart
Trend Analysis:
Function: Trend
Mode: Impulsive
Structure: Navy blue wave 3
Current Position: Gray wave 5
Direction for Next Higher Degrees: Continuation of navy blue wave 3
Detailed Analysis: The day chart analysis of the S&P BSE Sensex (India) reveals a trending market through Elliott Wave Theory. Currently, the market exhibits an impulsive mode, indicating strong directional price movements rather than a corrective or sideways trend.
The primary focus is on navy blue wave 3, an impulsive wave that reflects significant upward momentum, signifying a robust bullish trend. The market is currently in gray wave 5, usually the concluding wave in an impulsive sequence, which may signal an upcoming completion before a potential corrective phase.
For higher degree trends, the analysis projects the continuation of navy blue wave 3. This suggests that even after completing gray wave 5, the broader bullish trend represented by navy blue wave 3 is likely to continue.
The detailed analysis identifies that navy blue wave 2 of 5 has concluded, indicating the market has finished a corrective phase and is entering the next impulsive phase, identified as navy blue wave 3. This phase is expected to showcase strong upward price movements, reinforcing the overall bullish trend.
A critical aspect of this analysis is the wave cancellation invalid level, set at 69732.12. This level acts as a key threshold; if the market dips below this point, the current wave analysis will be invalidated, requiring a new assessment of the wave structure.
Summary: The S&P BSE Sensex day chart analysis suggests the market is in an impulsive phase within navy blue wave 3, following the completion of navy blue wave 2 of 5. The momentum in navy blue wave 3 indicates continued bullish activity. The wave cancellation invalid level is critical at 69732.12 to validate the current wave analysis.
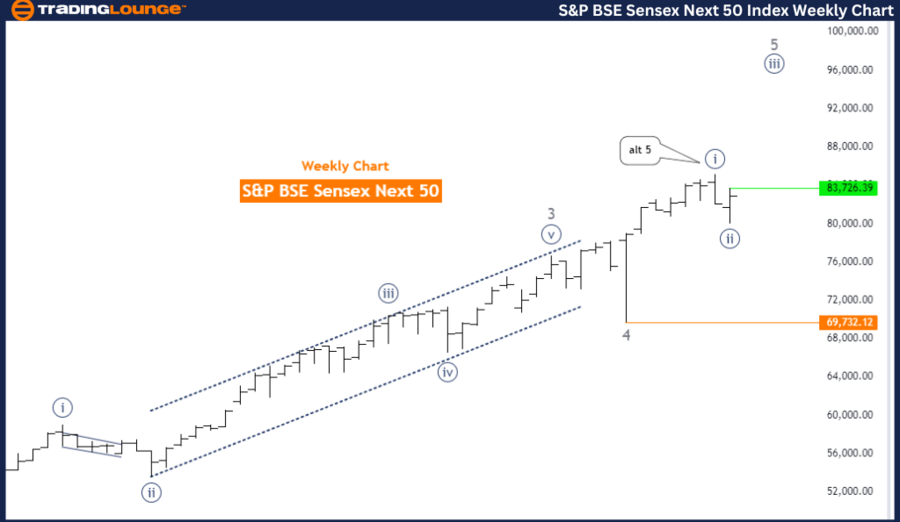
TradingLounge Index S&P BSE Sensex (India) Elliott Wave Analysis - Weekly Chart
S&P BSE Sensex (India) Elliott Wave Analysis - Weekly Chart
Trend Analysis:
Function: Trend
Mode: Impulsive
Structure: Navy blue wave 3
Current Position: Gray wave 5
Direction for Next Higher Degrees: Continuation of navy blue wave 3
Detailed Analysis: The weekly chart of the S&P BSE Sensex (India), analyzed via Elliott Wave Theory, offers an extensive view of the market trends. The analysis identifies the market's function as a trend, indicating that the prevailing market direction is expected to continue. The wave is classified as impulsive, pointing to strong and directional price movements, rather than corrective or sideways movements.
The key structure under analysis is navy blue wave 3, part of a larger impulsive sequence. This indicates that the market is experiencing substantial upward momentum. The current position within this sequence is gray wave 5, typically the final wave of an impulsive sequence before a possible corrective phase.
For higher degrees, the analysis continues to indicate navy blue wave 3, suggesting that even after the completion of gray wave 5, the overall bullish trend represented by navy blue wave 3 is expected to persist, implying sustained bullish momentum.
The detailed analysis shows that navy blue wave 2 of 5 has likely concluded. This completion suggests the market has ended a corrective phase and is now entering the next impulsive phase, identified as navy blue wave 3. This phase is characterized by strong upward price movements, reinforcing the bullish trend in the market.
A critical component of this analysis is the wave cancellation invalid level, set at 69732.12. This level is a crucial threshold; if the market price falls below this point, the current wave analysis would be invalidated, necessitating a reassessment of the wave structure.
Summary: The weekly chart analysis of the S&P BSE Sensex indicates the market is in an impulsive phase, specifically within navy blue wave 3, following the completion of navy blue wave 2 of 5. The continuation of navy blue wave 3 suggests ongoing bullish momentum. The wave cancellation invalid level is set at 69732.12, which is essential for confirming the validity of the current wave analysis.
Technical Analyst: Malik Awais
Source: visit Tradinglounge.com and learn From the Experts Join TradingLounge Here
See previous: KOSPI Composite Elliott Wave Analysis
Special Trial Offer - 0.76 Cents a Day for 3 Months! Click here
Access 7 Analysts Over 170 Markets Covered. Chat Room With Support