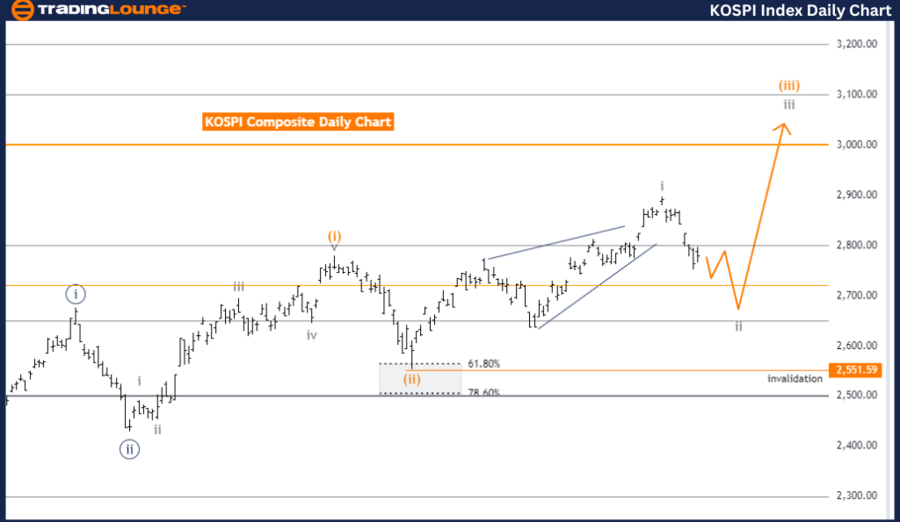
TradingLounge Index KOSPI Composite Elliott Wave Analysis - Daily Chart
KOSPI Composite Day Chart Analysis
KOSPI Composite Elliott Wave Analysis
Function: Counter Trend
Mode: Corrective
Structure: Gray Wave 2
Position: Orange Wave 3
Next Higher Degrees Direction: Gray Wave 3
Wave Cancel Invalid Level: 2551.59
The KOSPI Composite day chart analysis uses Elliott Wave Theory to detail market movements. The current function is a counter trend, indicating a move against the main trend.
Mode and Structure:
- Mode: Corrective, indicating retracement or consolidation.
- Structure: Gray Wave 2, a corrective wave within the Elliott Wave framework.
Current Position:
- Position: Within Orange Wave 3, the third wave in the orange wave sequence. Wave 3 usually shows strong, impulsive traits.
Next Higher Degrees:
- Direction: Toward Gray Wave 3. After Gray Wave 2, the market is expected to move into Gray Wave 3, an impulsive wave resuming the primary trend.
Details:
- Following Gray Wave 1, the market is in the corrective phase of Gray Wave 2 of 3. This sets up the market for the next significant move, Gray Wave 3 of 3. Gray Wave 2 is preparatory for the next impulsive phase.
Wave Cancel Invalid Level:
- Critical Level: 2551.59. Falling below this invalidates the current wave analysis, requiring reevaluation.
Summary:
The KOSPI Composite day chart indicates a corrective phase, Gray Wave 2 within Orange Wave 3. The next move is expected to transition into Gray Wave 3, resuming the primary trend. The wave cancel invalid level is 2551.59, key for validation.
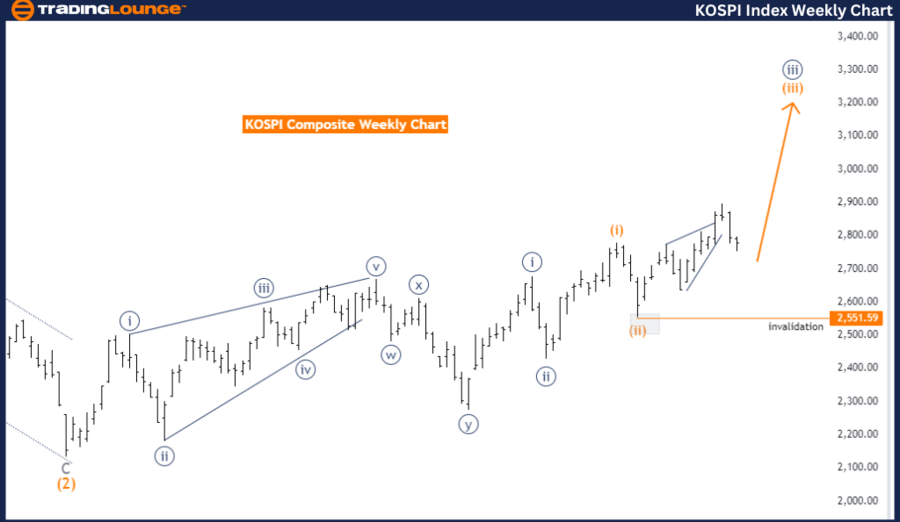
TradingLounge Index KOSPI Composite Elliott Wave Analysis - Weekly Chart
KOSPI Composite Weekly Chart Analysis
Elliott Wave Analysis by Trading Lounge
Function: Trend
Mode: Impulsive
Structure: Orange Wave 3
Position: Navy Blue Wave 3
Next Lower Degrees Direction: Orange Wave 4
Wave Cancel Invalid Level: 2551.59
The KOSPI Composite weekly chart analysis uses Elliott Wave Theory to interpret market behavior. The current movement is identified as a trend, aligning with the primary market direction.
Mode and Structure:
- Mode: Impulsive, suggesting strong directional market moves.
- Structure: Orange Wave 3, a significant wave in the Elliott Wave sequence.
Current Position:
- Position: Within Navy Blue Wave 3, a major phase with substantial moves and trading activity.
Next Lower Degrees:
- Direction: Towards Orange Wave 4. After the impulsive Orange Wave 3, the market is expected to enter a corrective phase, Orange Wave 4, retracing some gains.
Details:
- Orange Wave 2 appears completed, setting the stage for Orange Wave 3 of 3. This represents a strong, impulsive move within the broader trend, often with significant price movements and volatility.
Wave Cancel Invalid Level:
- Critical Level: 2551.59. Falling below this invalidates the current wave analysis, requiring reevaluation.
Summary:
The KOSPI Composite weekly chart indicates an impulsive phase, Orange Wave 3 within Navy Blue Wave 3. The next move is expected to transition into Orange Wave 4, a corrective phase. The wave cancel invalid level is 2551.59, key for validation.
Technical Analyst: Malik Awais
Source: visit Tradinglounge.com and learn From the Experts Join TradingLounge Here
See previous: S&P 500 Elliott Wave Technical Analysis
Special Trial Offer - 0.76 Cents a Day for 3 Months! Click here
Access 7 Analysts Over 170 Markets Covered. Chat Room With Support