26Jul

Offering Traders Valuable Guidance on AVY's Market Trajectory: Avery Dennison Corp. Stocks Elliott Wave Technical Analysis

TradingLounge Elliott Wave Analysis: Avery Dennison Corp. (AVY) Daily Chart

Welcome to our comprehensive Elliott Wave analysis for Avery Dennison Corp. (AVY). This article explores AVY's price movements through the lens of Elliott Wave Theory, helping traders pinpoint potential trading opportunities. We'll analyze data from both the daily and 4-hour charts to provide a detailed view of AVY's market dynamics.

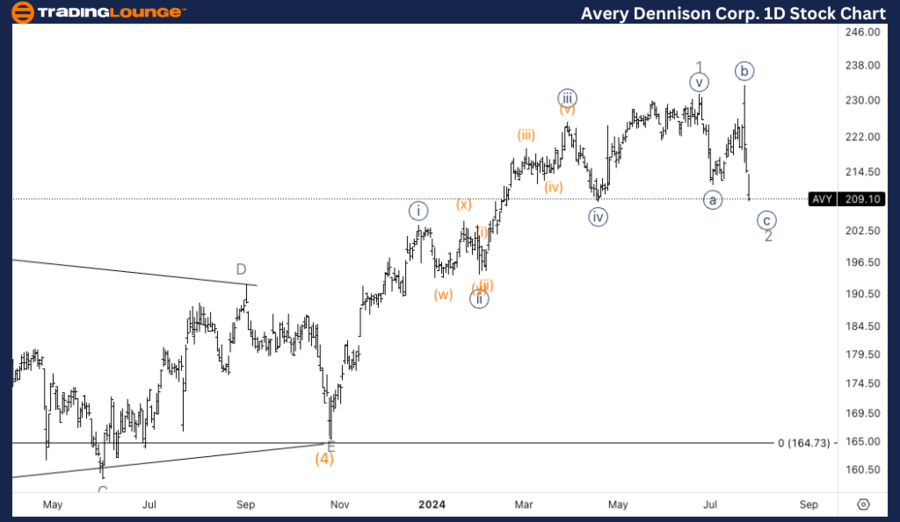
Avery Dennison Corp. (AVY) Daily Chart Overview

AVY Elliott Wave Technical Analysis

Function: Counter Trend

Mode: Corrective

Structure: Flat

Position: Wave 2

Direction: Bottom in Wave 2

Details: The daily chart indicates that AVY is nearing the bottom of wave 2 within an Intermediate wave (5). The price action suggests that wave 1 of (5) has already reached an all-time high (ATH), pointing to strong bullish momentum. We are currently observing for the bottom of wave 2, which, once established, could trigger the continuation of the uptrend in wave 3 of (5).

Avery-Dennison-Corp-...


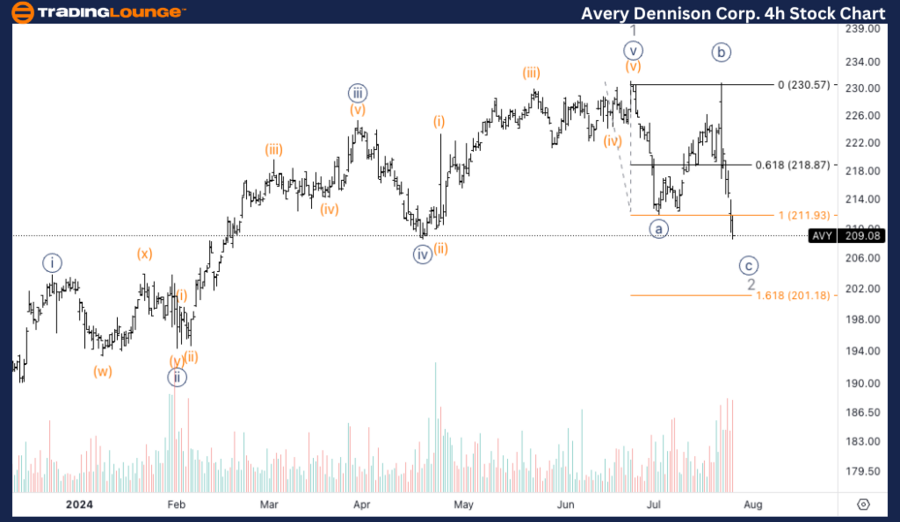
AVY Elliott Wave Analysis - 4-Hour Chart

Avery Dennison Corp. (AVY) 4H Chart Overview

AVY Elliott Wave Technical Analysis

Function: Counter Trend

Mode: Corrective

Structure: Flat

Position: Wave {c} of 2

Direction: Bottom in Wave {c}

Details: The 4-hour chart offers a closer examination of wave {c} of 2. Here, the price has entered the area between the equality and 1.618 times the length of wave {a}, a common target zone for wave {c}. The increased volume suggests a potential bottom formation is near. Traders should monitor this area closely for signs of a bounce, which could signal the resumption of the overall uptrend.

Technical Analyst: Alessio Barretta

Source: visit Tradinglounge.com and learn From the Experts Join TradingLounge Here 

See Previous: NextEra Energy Inc. (NEE) Elliott Wave Technical Analysis

Special Trial Offer - 0.76 Cents a Day for 3 Months! Click here

Access 7 Analysts Over 170 Markets Covered. Chat Room With Support

Avery-Dennison-Corp-...

Related

Elliott Wave Analysis for News Corporation (ASX:NWS) with Stock Forecast, Wave Counts, Technical Levels, and Trading Strategy Insights

Elliott Wave Analysis for News Corporation (ASX:NWS) with Stock Forecast, Wave Counts, Technical Levels, and Trading Strategy Insights

Elliott Wave analysis of News Corporation (ASX:NWS), highlighting current corrective wave structures...

Read More >
Using Elliott Wave Theory We Forecast Potential Shifts in DE Stock: Deere & Co Stock Current Market Trends and Movements

Using Elliott Wave Theory We Forecast Potential Shifts in DE Stock: Deere & Co Stock Current Market Trends and Movements

This detailed Elliott Wave analysis of Deere & Co. (DE) highlights current market trends and price m...

Read More >
Market dynamics: Microsoft Inc.(MSFT) Elliott Wave Technical Analysis Insights

Market dynamics: Microsoft Inc.(MSFT) Elliott Wave Technical Analysis Insights

Our Elliott Wave analysis of Microsoft Inc. (MSFT), reveals a counter-trend sentiment with correctiv...

Read More >
Natural Gas Commodity Elliottwave Technical Analysis:  An In-depth Analysis of the Current Impulse Wave

Natural Gas Commodity Elliottwave Technical Analysis: An In-depth Analysis of the Current Impulse Wave

Elliott Wave analysis of Natural Gas, focusing on the ongoing impulse wave sequence that began in A...

Read More >
Unlocking ASX Trading Success: BRAMBLES LIMITED - BXB Stock Analysis & Elliott Wave Technical Forecast

Unlocking ASX Trading Success: BRAMBLES LIMITED - BXB Stock Analysis & Elliott Wave Technical Forecast

Our in-depth Elliott Wave analysis of BRAMBLES LIMITED (BXB) on the Australian Stock Exchange (ASX) ...

Read More >
Wheat Elliott Wave Analysis Predicts Ending Diagonal in Wave V, Resisting in Wave C, Major Trend Reversal Toward $500

Wheat Elliott Wave Analysis Predicts Ending Diagonal in Wave V, Resisting in Wave C, Major Trend Reversal Toward $500

Wheat futures have been climbing since May 13, 2025, nearing a resistance zone. This appears to be t...

Read More >

$1 for 2 Weeks

then $29 a month!

What a Special Offer!

Trade Recommendations

Unleash the power of deversified trading with our comprehensive portfolio, covering 250+ markets:

  • Stock Trades
  • Crypto Trades
  • Forex Trades
  • Commodity Trades
Elliott Wave Analysis

Gain a competitive edge with expert insights and AI-powered Elliott Wave charting into:

  • Global Indices
  • US Stocks & ASX Stocks
  • Forex & Crypto
  • Commodities
Top-Notch Trading Tools

Equip yourself with the tools of success:

  • Real-time Chat rooms
  • Elliott Wave Algorithm
  • Portfolio tools
  • TradingLevels
  • Screener
  • Trading Game
7 Elliott Wave Analysts

Stay ahead of the market with daily charts and insightful videos
Your secret to strategic trading!

JOIN HERE


Welcome to TradingLounge (ASIC A.R.No. 321187), specialists in trades, trading education and technical analysis, covering stocks, indices, commodities, forex and cryptocurrencies.

When you join TradingLounge you have access to everything we offer, including trade tools, educational content and a social platform to chat with like-minded investors.

Read more

@Copyright 2024 by tradinglounge.com

Contact Us

Australian no: 02 4787 6020

International no: +61 (2) 47876020

Pay with:

Find us on