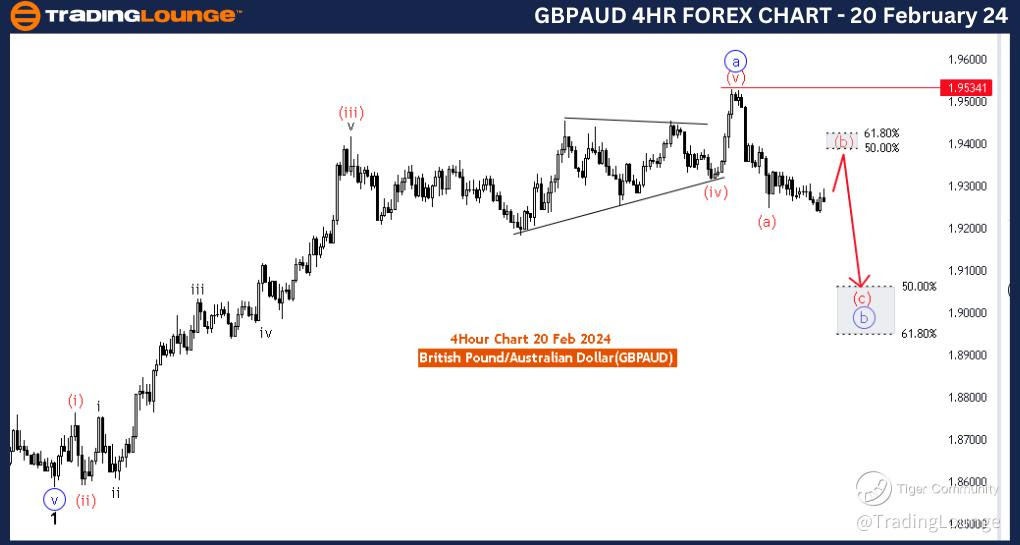
GBPAUD Elliott Wave Analysis Trading Lounge 4 Hour Chart, 20 February 24
British Pound/ Australian Dollar(GBPAUD) 4 Hour Chart
GBPAUD Elliott Wave Technical Analysis
FUNCTION: Counter Trend
MODE: Corrective
STRUCTURE: Red wave B
POSITION: Blue wave B
DIRECTION NEXT LOWER DEGREES: Red wave C
DETAILS: red wave A of B looking completed at 1.92446, now red wave b of B is in play . Wave Cancel invalid level: 1.95341
The "GBPAUD Elliott Wave Analysis Trading Lounge 4 Hour Chart" dated 20 February 24, presents an in-depth analysis of the British Pound/Australian Dollar (GBPAUD) currency pair utilizing Elliott Wave principles. This analysis, conducted on the 4-hour chart, focuses on identifying potential price movements within the context of the Elliott Wave theory.
The identified "FUNCTION" in this analysis is "Counter Trend," suggesting that the evaluation is centered around a phase that opposes the prevailing trend. Traders often look for counter-trend opportunities to capitalize on potential reversals or corrective movements.
The specified "MODE" is "Corrective," indicating that the market is currently undergoing a corrective wave. Corrective waves are crucial components of the Elliott Wave theory, representing temporary price movements that deviate from the primary trend. Traders use corrective phases to identify potential entry points or reversals.
The described "STRUCTURE" is "Red wave B," signifying the current phase in the Elliott Wave sequence. In Elliott Wave theory, wave B is typically part of a corrective structure, acting as an intervening wave between the initial downward movement (wave A) and the final downward movement (wave C). Understanding the structure helps traders anticipate potential future price movements.
The designated "POSITION" is "Blue wave B," indicating the current position within the broader Elliott Wave pattern. In corrective structures, wave B often represents an intervening wave between the initial downward movement (wave A) and the final downward movement (wave C). Traders use this information to gauge where the market is within the larger wave pattern.
Concerning "DIRECTION NEXT LOWER DEGREES," the analysis points to "Red wave C," indicating the expected direction of the next lower-degree wave. This information is valuable for traders looking to anticipate broader market trends and position themselves accordingly.
In the "DETAILS" section, it is highlighted that "red wave A of B looking completed at 1.92446, now red wave b of B is in play." This suggests that the corrective phase is in progress, and traders should monitor the development of wave b of B for potential trading opportunities.
In conclusion, the GBPAUD Elliott Wave Analysis for the 4-hour chart on 20 February 24, indicates a counter-trend corrective phase with the market currently in the "red wave B" of a broader Elliott Wave pattern. Traders are advised to monitor the progression of wave b of B for potential trading opportunities, keeping in mind the forthcoming red wave C.
Technical Analyst: Malik Awais
Source: visit Tradinglounge.com and learn From the Experts Join TradingLounge Here
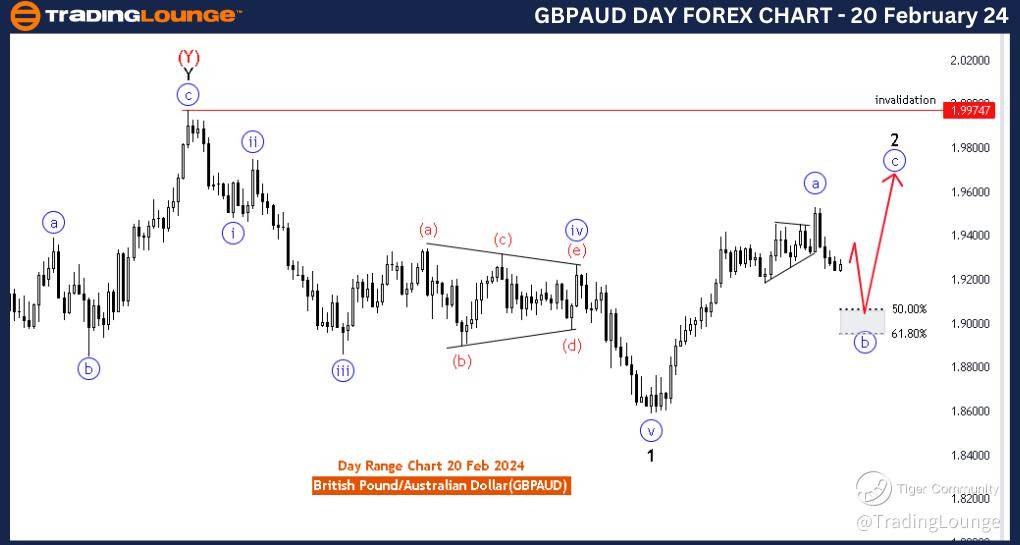
GBPAUD Elliott Wave Analysis Trading Lounge Day Chart, 20 February 24
British Pound/ Australian Dollar(GBPAUD) Day Chart
GBPAUD Elliott Wave Technical Analysis
FUNCTION: Counter Trend
MODE: Corrective
STRUCTURE: blue wave B
POSITION: black wave 2
DIRECTION NEXT HIGHER DEGREES: blue wave C
DETAILS: red wave 5 of A looking completed at 1.95271, now blue wave b of 2 is in play . Wave Cancel invalid level: 1.99747
The "GBPAUD Elliott Wave Analysis Trading Lounge Day Chart" dated 20 February 24, provides a comprehensive analysis of the British Pound/Australian Dollar (GBPAUD) currency pair on the daily chart, employing Elliott Wave principles. The focus is on identifying potential price movements within the context of the Elliott Wave theory.
The identified "FUNCTION" in this analysis is "Counter Trend," suggesting that the assessment revolves around a phase that opposes the prevailing trend. Counter-trend analysis is crucial for traders looking to identify potential reversals or corrective movements in the market.
The specified "MODE" is "Corrective," indicating that the market is currently undergoing a corrective wave. Corrective waves are essential components of the Elliott Wave theory, representing temporary price movements that deviate from the primary trend. Traders use corrective phases to anticipate potential entry points or reversals.
The described "STRUCTURE" is "Blue wave B," signifying the current phase in the Elliott Wave sequence. Wave B is typically part of a corrective structure, acting as an intervening wave between the initial downward movement (wave A) and the final downward movement (wave C). Understanding the structure helps traders anticipate potential future price movements.
The designated "POSITION" is "Black wave 2," indicating the current position within the broader Elliott Wave pattern. In corrective structures, wave 2 often represents a counter-trend movement before the resumption of the broader trend. Traders use this information to gauge where the market is within the larger wave pattern.
Concerning "DIRECTION NEXT HIGHER DEGREES," the analysis points to "Blue wave C," indicating the expected direction of the next higher-degree wave. This information is valuable for traders looking to anticipate broader market trends and position themselves accordingly.
In the "DETAILS" section, it is highlighted that "red wave 5 of A looking completed at 1.95271, now blue wave b of 2 is in play." This suggests that the corrective phase is in progress, and traders should monitor the development of wave b of 2 for potential trading opportunities.
In conclusion, the GBPAUD Elliott Wave Analysis for the daily chart on 20 February 24, indicates a counter-trend corrective phase with the market currently in the "blue wave B" of a broader Elliott Wave pattern. Traders are advised to monitor the progression of wave b of 2 for potential trading opportunities, keeping in mind the forthcoming blue wave C.
Technical Analyst: Malik Awais
Source: visit Tradinglounge.com and learn From the Experts Join TradingLounge Here
See Previous: Euro/British Pound (EURGBP)