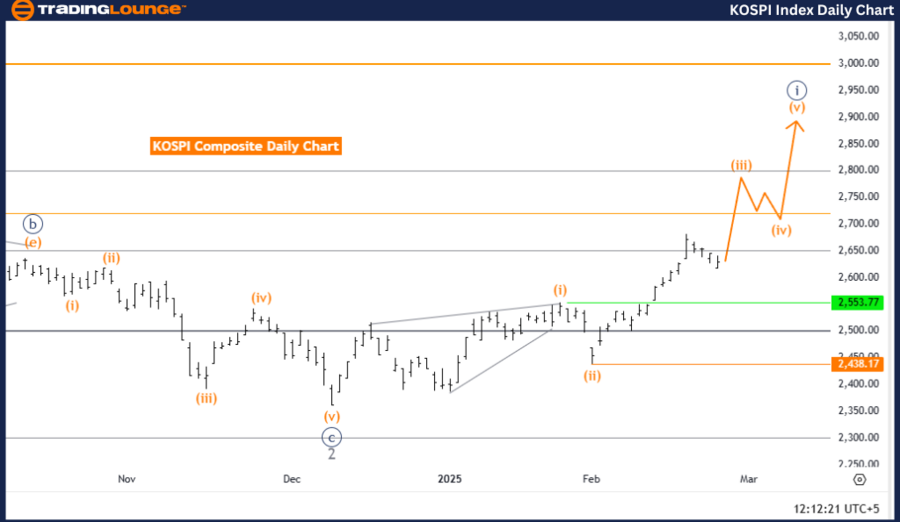
KOSPI Composite Elliott Wave Analysis – Trading Lounge Day Chart
KOSPI Composite Elliott Wave Technical Analysis
Function: Bullish Trend
Mode: Impulsive
Structure: Orange Wave 3
Position: Navy Blue Wave 1
Next Lower Degree Direction: Orange Wave 4
Wave Cancellation Invalid Level: 2,438.17
Analysis Overview
The KOSPI Composite Elliott Wave Analysis for the day chart confirms a bullish trend, with the market currently in an impulsive wave phase. The structure, identified as Orange Wave 3, is part of a broader Navy Blue Wave 1, reinforcing a strong uptrend. This pattern is consistent with a typical Elliott Wave impulsive structure.
The next expected move is Orange Wave 4, likely to emerge after the completion of Orange Wave 3.
Key Insights
- Wave 2 Completion: The market appears to have completed Orange Wave 2, marking the transition to Orange Wave 3.
- Wave 3 Momentum: Orange Wave 3 is expected to show continued bullish momentum, aligning with an impulsive wave's characteristics.
- Potential Corrective Phase: After Orange Wave 3, a corrective phase could occur as Orange Wave 4, potentially leading to pullbacks or consolidation before the uptrend resumes.
Critical Level to Watch
- Wave Cancellation Invalid Level: 2,438.17
- A break below 2,438.17 invalidates the current Elliott Wave count, prompting a market reassessment.
- This key support level serves as a trend confirmation point, and a breach could indicate a structural shift in price action.
Conclusion
The KOSPI Composite Index remains in a bullish Elliott Wave structure, with Orange Wave 3 progressing after the completion of Orange Wave 2. The next expected movement, Orange Wave 4, could introduce a corrective phase before the broader uptrend resumes.
Traders should closely monitor price action around 2,438.17, as this level determines the validity of the wave structure and the continuation of the bullish outlook. Understanding Elliott Wave formations is crucial for forecasting market movements and refining trading strategies.
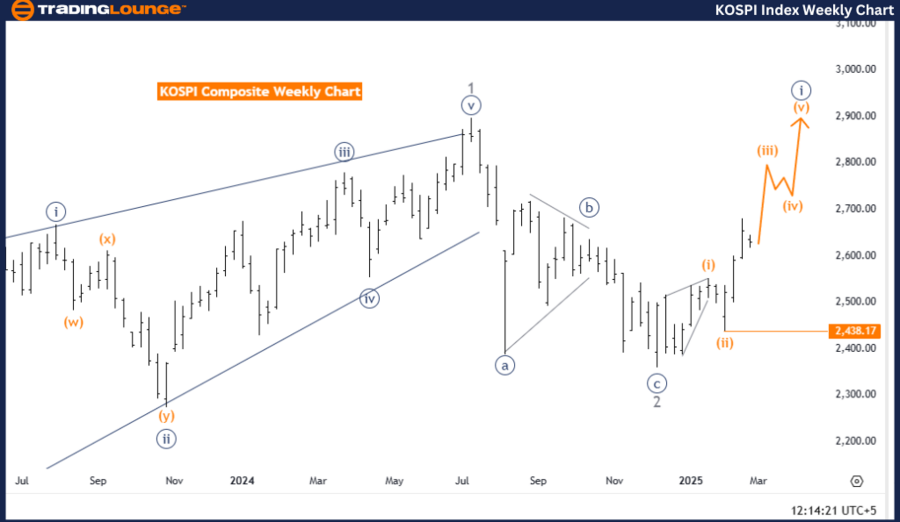
KOSPI Composite Elliott Wave Analysis – Trading Lounge Weekly Chart
KOSPI Composite Elliott Wave Technical Analysis
Function: Bullish Trend
Mode: Impulsive
Structure: Orange Wave 3
Position: Navy Blue Wave 1
Next Lower Degree Direction: Orange Wave 4
Wave Cancellation Invalid Level: 2,438.17
Analysis Overview
The KOSPI Composite Elliott Wave Analysis for the weekly chart continues to indicate a bullish trend, with the market progressing in an impulsive wave structure. The Orange Wave 3, part of Navy Blue Wave 1, supports an ongoing strong uptrend, in line with the Elliott Wave impulsive phase characteristics.
The next anticipated movement is Orange Wave 4, which may develop following the completion of Orange Wave 3.
Key Insights
- Wave 2 Completion: Orange Wave 2 has likely concluded, marking the transition to Orange Wave 3.
- Wave 3 Momentum: Orange Wave 3 is expected to sustain strong bullish movement, consistent with impulsive wave dynamics.
- Potential Corrective Phase: Once Wave 3 ends, Orange Wave 4 could introduce a corrective phase, possibly resulting in temporary pullbacks or market consolidation before the uptrend resumes.
Critical Level to Watch
- Wave Cancellation Invalid Level: 2,438.17
- A drop below 2,438.17 invalidates the current Elliott Wave count, requiring a revised market analysis.
- This support level plays a crucial role in sustaining the bullish trend, and a breach may indicate a market structure shift.
Conclusion
The KOSPI Composite Index maintains a bullish trajectory, with Orange Wave 3 currently developing after the completion of Orange Wave 2. The expected next movement, Orange Wave 4, may introduce a corrective phase, leading to potential retracements before the trend resumes.
Traders should monitor price action around 2,438.17, as it serves as a key validation level for the current Elliott Wave count and the continuation of the bullish trend. A strategic understanding of wave structures helps in anticipating price movements and optimizing trading strategies.
Technical Analyst: Malik Awais
Source: visit Tradinglounge.com and learn From the Experts Join TradingLounge Here
Previous: DOW JONES (DJI) Elliott Wave Technical Analysis
VALUE Offer - Buy 1 Month & Get 3 Months!Click here
Access 7 Analysts Over 200 Markets Covered. Chat Room With Support