11Jun

Caterpillar Inc.(CAT) Stocks Elliott Wave Technical Analysis: Highlights key Fibonacci retracement levels and potential reversal points

Welcome to our comprehensive Elliott Wave analysis for Caterpillar Inc. (CAT). This in-depth examination leverages the Elliott Wave Theory to help traders identify potential opportunities by analyzing CAT's price movements. Our insights span both daily and 4-hour charts, providing a thorough perspective on CAT's market behavior.

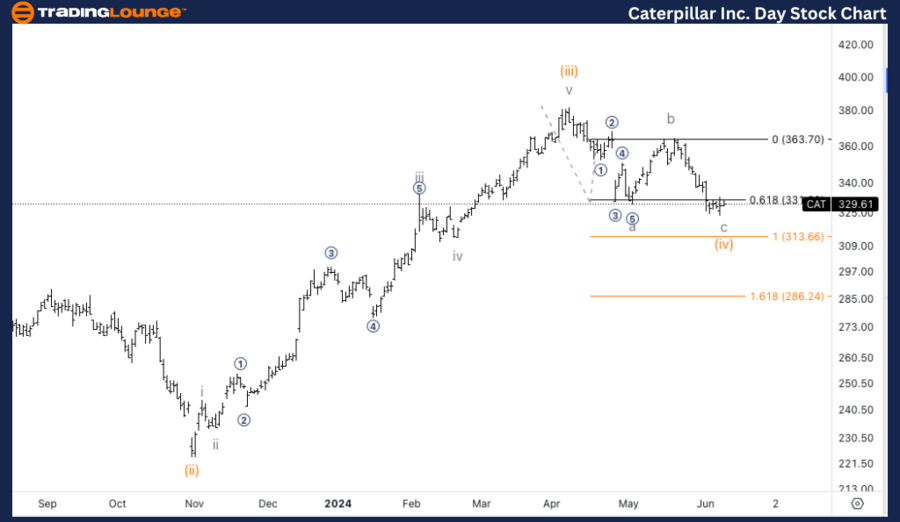
CAT Elliott Wave Analysis Trading Lounge Daily Chart

Caterpillar Inc. (CAT) Daily Chart Analysis

CAT Elliott Wave Technical Analysis

Function: Counter Trend

Mode: Corrective

Structure: Zigzag

Position: Minuette wave (iv)

Direction: Bottom in (iv)

Details: We are looking for a bottom in Minuette wave (iv), as it has reached the 0.618 Fibonacci retracement level compared to wave a. The equality level is at $313.

In our daily Elliott Wave analysis of Caterpillar Inc. (CAT), we identify a counter-trend corrective pattern forming a Zigzag structure. Currently, CAT is in Minuette wave (iv), indicating a potential bottom in this corrective phase. The price has reached the 0.618 Fibonacci retracement level relative to wave a, with the equality level at $313. Traders should watch this key support area for signs of a reversal, which may indicate the end of wave (iv) and the beginning of a new upward movement.

Caterpillar-Inc-Day-...


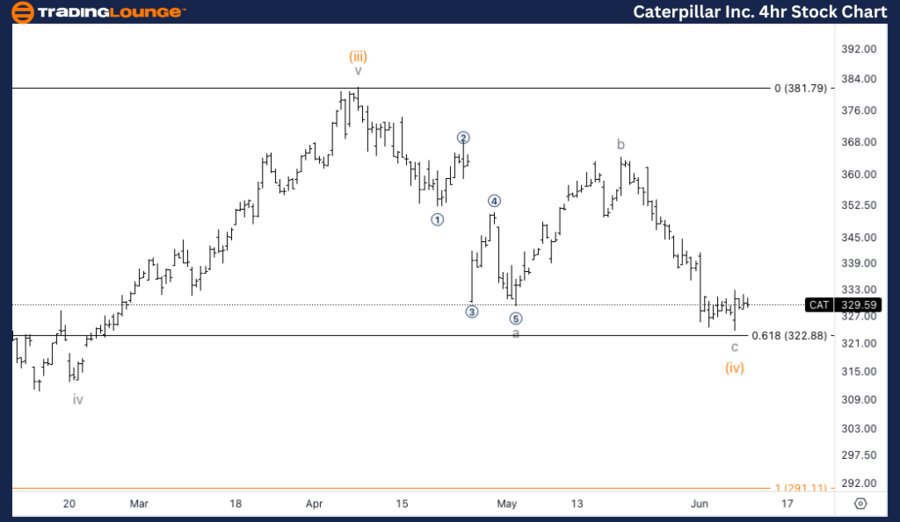
CAT Elliott Wave Analysis Trading Lounge 4-Hour Chart

Caterpillar Inc. (CAT) 4-Hour Chart Analysis

CAT Elliott Wave Technical Analysis

Function: Counter Trend

Mode: Corrective

Structure: Zigzag

Position: Wave c of (iv)

Direction: Bottom in c

Details: We are looking for a bottom in wave c, targeting the 0.618 retracement level of wave (iv) versus wave (ii) at $322, a commonly respected ratio, followed by equality.

In our 4-hour Elliott Wave analysis of Caterpillar Inc. (CAT), we observe a counter-trend corrective pattern in a Zigzag structure. CAT is currently in wave c of (iv), suggesting a potential bottom at the 0.618 retracement level of wave (iv) compared to wave (ii), around $322. Traders should monitor this level for a possible reversal, which could mark the end of wave c and signal a new upward trend.

Technical Analyst: Alessio Barretta

Source: visit Tradinglounge.com and learn From the Experts Join TradingLounge Here 

See Previous: Exxon Mobil Inc. (XOM) Elliott Wave Technical Analysis

Special Trial Offer - 0.76 Cents a Day for 3 Months! Click here

Access 7 Analysts Over 170 Markets Covered. Chat Room With Support

Caterpillar-Inc-4hr-...

Related

Successful forex trading with expert insights: Australian Dollar/U.S.Dollar (AUDUSD) Elliott Wave Technical Analysis

Successful forex trading with expert insights: Australian Dollar/U.S.Dollar (AUDUSD) Elliott Wave Technical Analysis

Discover the latest AUDUSD Elliott Wave analysis for March 12, 2024, providing comprehensive insight...

Read More >
Nestle India Stock Analysis with Elliott Wave Technical Patterns, Corrective Waves, Resistance Levels, and Chart Insights

Nestle India Stock Analysis with Elliott Wave Technical Patterns, Corrective Waves, Resistance Levels, and Chart Insights

This comprehensive analysis of Nestle India stock dives into Elliott Wave patterns, including correc...

Read More >
The Coca-Cola Company (KO:NYSE) Elliott Wave Technical Analysis 21 November 23

The Coca-Cola Company (KO:NYSE) Elliott Wave Technical Analysis 21 November 23

The Coca-Cola Company (KO: NYSE) Elliott Wave Technical Analysis dated 21 November 23, with 4-hour ...

Read More >
Stocks Bullish Trend: NASDAQ, AAPL, AMZN, NVDA, TSLA, GOOGL, META, NFLX, MSFT, Elliott Wave Analysis

Stocks Bullish Trend: NASDAQ, AAPL, AMZN, NVDA, TSLA, GOOGL, META, NFLX, MSFT, Elliott Wave Analysis

NASDAQ Stock Market Elliott Wave Analysis and Trading Strategies Our Elliott Wave analysis covers t...

Read More >
ASX: WESTPAC BANKING CORPORATION Elliott Wave Analysis – WBC Stock Forecast, Fibonacci Targets & ASX Market Trends

ASX: WESTPAC BANKING CORPORATION Elliott Wave Analysis – WBC Stock Forecast, Fibonacci Targets & ASX Market Trends

Westpac Banking Corporation (ASX: WBC) analysis provides insights into current market trends, share ...

Read More >
Information on Commodity Market Dynamics and Price Forecasts: Coffee Elliott Wave Technical Analysis

Information on Commodity Market Dynamics and Price Forecasts: Coffee Elliott Wave Technical Analysis

This article provides a comprehensive Elliott Wave Analysis of Coffee commodities. It covers technic...

Read More >

Buy 1 Month

Get 3 Months!

Special Offer:

Trade Recommendations

Unleash the power of deversified trading with our comprehensive portfolio, covering:

  • Stock Trades
  • Crypto Trades
  • Forex Trades
  • Commodity Trades
Elliott Wave Analysis

Gain a competive edge with expert insights in to:

  • Global Indices
  • US Stocks & ASX Stocks
  • Forex & Crypto
  • Commodities
Top-Notch Trading Tools

Equip yourself with the tools of success:

  • Social Chat
  • Elliott Wave Algorithm
  • Screener
  • TradingLevels
  • Trading Game
7 Elliott Wave Analysts

Stay ahead of the market with daily charts and insightful videos
-Your secret to strategic trading!

JOIN HERE


Welcome to TradingLounge (ASIC A.R.No. 321187), specialists in trades, trading education and technical analysis, covering stocks, indices, commodities, forex and cryptocurrencies.

When you join TradingLounge you have access to everything we offer, including trade tools, educational content and a social platform to chat with like-minded investors.

Read more

@Copyright 2024 by tradinglounge.com

Contact Us

Australian no: 02 4787 6020

International no: +61 (2) 47876020

Pay with:

Find us on