26May

Theta Token (THETAUSD) Wave 4 Consolidation Near Fibonacci Support Points to Wave 5 Breakout Opportunity in Bullish Elliott Wave Setup

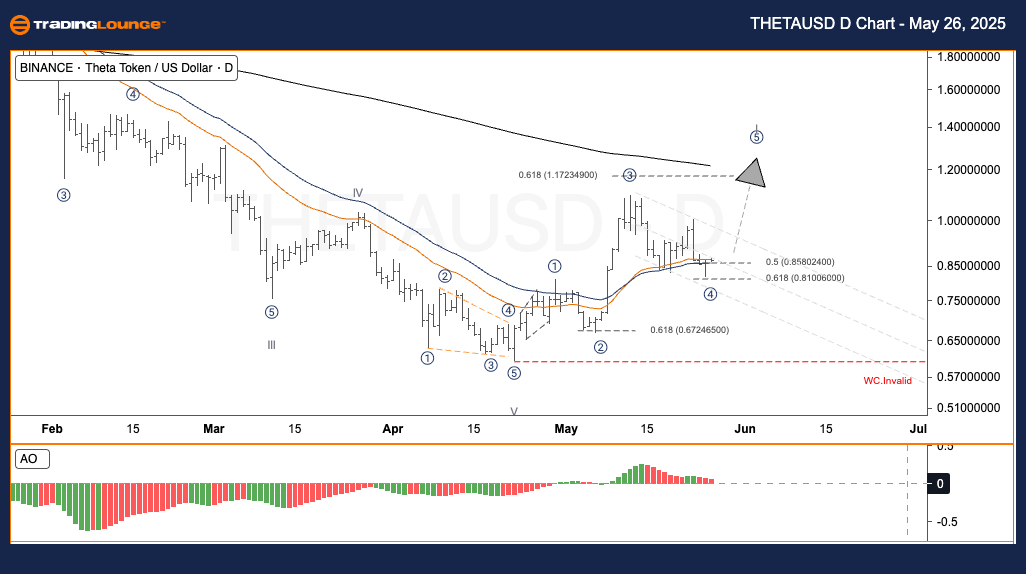
Theta Token / U.S. Dollar (THETAUSD) Elliott Wave Analysis TradingLounge Daily Chart

THETAUSD Elliott Wave Technical Analysis

Function: Follow trend

Mode: Motive

Structure: Impulse

Position: Wave 4

Direction Next Higher Degrees: –

Wave Cancel Invalid Level: –

Theta Token / U.S. Dollar (THETAUSD) Forecast and Strategy:
Theta Token (THETAUSD) is consolidating in wave 4 within a broader bullish Elliott Wave formation. This retracement phase is developing inside the expected correction zone, favoring the start of wave 5 — the next impulsive move upward. Following the completion of waves III and V earlier, the market has transitioned into a new structural phase. Waves 1 through 3 have already been established, and wave 4 is currently progressing. This wave is projected to find support in the Fibonacci retracement levels between 0.5 ($0.8580) and 0.618 ($0.8100). A confirmed bullish reversal in this range can lead to wave 5 extending toward the $1.17 to $1.30 resistance zone.

Trading Strategies

Strategy

  • Short-Term Outlook (Swing Trading):

Monitor for bullish candlestick patterns such as an engulfing setup or breakout from current consolidation.

  • Risk Management:

Place Stop Loss slightly below $0.80.

Take Profit within the anticipated wave 5 resistance range of $1.17–$1.30.

THETAUSD-d-Crypto-Ch...


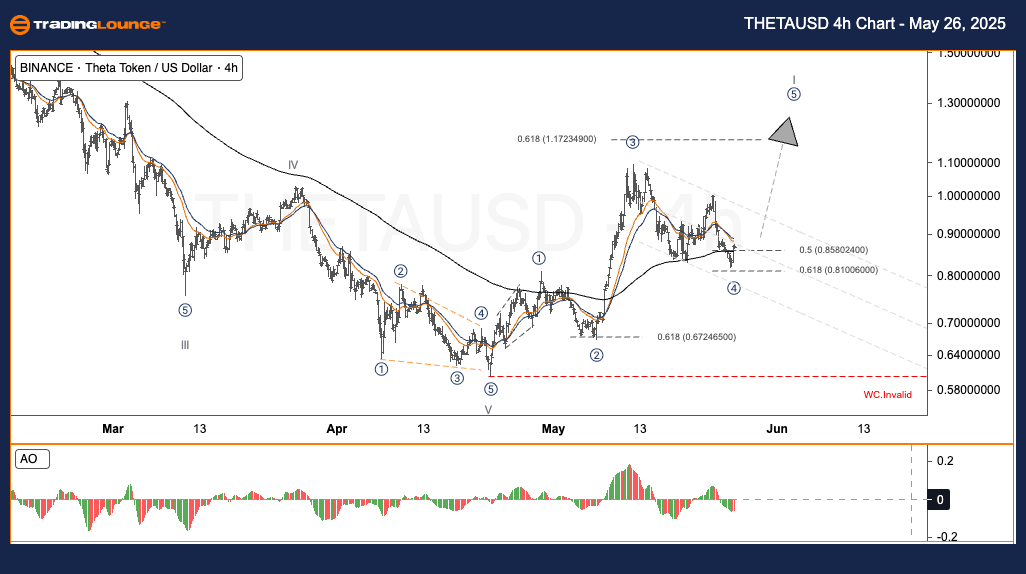
Theta Token / U.S. Dollar (THETAUSD) Elliott Wave Analysis TradingLounge H4 Chart

THETAUSD Elliott Wave Technical Analysis

Function: Follow trend

Mode: Motive

Structure: Impulse

Position: Wave 4

Direction Next Higher Degrees: –

Wave Cancel Invalid Level: –

Theta Token / U.S. Dollar (THETAUSD) Forecast and Strategy:
Theta Token (THETAUSD) continues to consolidate in wave 4, fitting within the overall bullish Elliott Wave outlook. This corrective wave is moving through the ideal retracement zone often referred to as the "golden pocket," setting up conditions for the potential initiation of wave 5. The completion of prior waves III and V has laid the groundwork for a new price structure. With waves 1, 2, and 3 already confirmed, wave 4 is expected to bottom between the 0.5 Fibonacci level ($0.8580) and 0.618 ($0.8100). A rebound from this zone would support a bullish continuation into wave 5, aiming for the $1.17–$1.30 area.

Trading Strategies

Strategy

  • Short-Term Approach (Swing Trade):

Watch for confirmation of a bullish move — examples include breakout candles or engulfing formations.

  • Risk Management:

Set Stop Loss below $0.80.

Target the upper range of wave 5, between $1.17 and $1.30.

Technical Analyst: Malik Awais

Source: Visit Tradinglounge.com and learn from the Experts. Join TradingLounge Here

Previous: EURUSD Elliott Wave Technical Analysis

VALUE Offer - Buy 1 Month & Get 3 Months!Click here

Access 7 Analysts Over 200 Markets Covered. Chat Room With Support

THETAUSD-4h-Crypto-C...

Related

Soybeans Commodity Elliott Wave Technical Analysis: Detailing the Market Trends, and Price Forecasts

Soybeans Commodity Elliott Wave Technical Analysis: Detailing the Market Trends, and Price Forecasts

This article provides a comprehensive Elliott Wave Analysis for soybeans, detailing the market trend...

Read More >
U.S. Dollar / Japanese Yen (USDJPY) Forex Elliott Wave Technical Analysis Reveals Key Correction and Wave Breakout Setup

U.S. Dollar / Japanese Yen (USDJPY) Forex Elliott Wave Technical Analysis Reveals Key Correction and Wave Breakout Setup

USDJPY shows a corrective wave 2 unfolding in a broader bullish trend. Watch for reversal signals an...

Read More >
INSURANCE AUSTRALIA GROUP LIMITED (IAG) Elliott Wave Analysis: Price Levels & Market Trends for Smarter Trading Decisions

INSURANCE AUSTRALIA GROUP LIMITED (IAG) Elliott Wave Analysis: Price Levels & Market Trends for Smarter Trading Decisions

Elliott Wave technical analysis for ASX: IAG (Insurance Australia Group Limited) provides a detailed...

Read More >
NEOUSD Elliott Wave Technical Analysis: NEO Price Prediction, Trading Strategy, Zigzag Patterns, Technical Indicators

NEOUSD Elliott Wave Technical Analysis: NEO Price Prediction, Trading Strategy, Zigzag Patterns, Technical Indicators

Elliott Wave analysis of NEOUSD, detailing the corrective Wave (2) phase, trading strategies for the...

Read More >
Dow Jones Forecast Using Elliott Wave: Bullish Trend Confirmed with Impulse Wave Signals on Daily and Weekly DJI Charts

Dow Jones Forecast Using Elliott Wave: Bullish Trend Confirmed with Impulse Wave Signals on Daily and Weekly DJI Charts

This Dow Jones Elliott Wave analysis outlines a bullish outlook with impulsive wave structures, conf...

Read More >

Buy 1 Month

Get 3 Months!

Special Offer:

Trade Recommendations

Unleash the power of deversified trading with our comprehensive portfolio, covering:

  • Stock Trades
  • Crypto Trades
  • Forex Trades
  • Commodity Trades
Elliott Wave Analysis

Gain a competive edge with expert insights in to:

  • Global Indices
  • US Stocks & ASX Stocks
  • Forex & Crypto
  • Commodities
Top-Notch Trading Tools

Equip yourself with the tools of success:

  • Social Chat
  • Elliott Wave Algorithm
  • Screener
  • TradingLevels
  • Trading Game
7 Elliott Wave Analysts

Stay ahead of the market with daily charts and insightful videos
-Your secret to strategic trading!

JOIN HERE


Welcome to TradingLounge (ASIC A.R.No. 321187), specialists in trades, trading education and technical analysis, covering stocks, indices, commodities, forex and cryptocurrencies.

When you join TradingLounge you have access to everything we offer, including trade tools, educational content and a social platform to chat with like-minded investors.

Read more

@Copyright 2024 by tradinglounge.com

Contact Us

Australian no: 02 4787 6020

International no: +61 (2) 47876020

Pay with:

Find us on