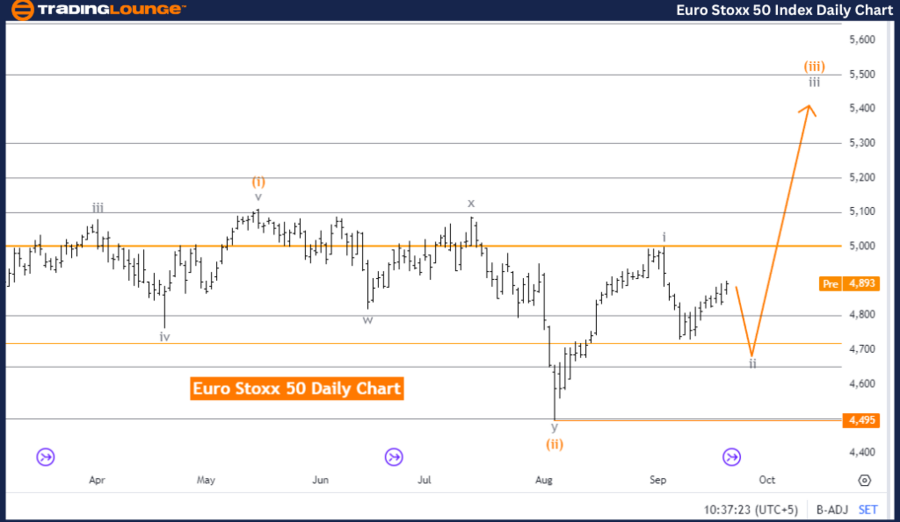
Euro Stoxx 50 Elliott Wave Analysis - Trading Lounge Day Chart

Euro Stoxx 50 Elliott Wave Technical Analysis

  • Function: Counter Trend

  • Mode: Corrective

  • Structure: Gray Wave 2

  • Position: Orange Wave 3

  • Next Higher Degree: Gray Wave 3

  • Wave Cancel Invalid Level: 4495

The Elliott Wave analysis for the Euro Stoxx 50 index on the daily chart shows a counter-trend movement. This signals a temporary pause or pullback within the broader market direction. The current mode is corrective, indicating that the market is consolidating or pulling back within a larger upward trend.

The focus is on gray wave 2, which is part of the corrective structure in the overall wave sequence. With gray wave 1 already completed, the market is now moving through gray wave 2 of orange wave 3. This suggests a short-term correction within the larger impulsive move.

Once gray wave 2 finishes, the market is expected to resume its upward trajectory in orange wave 3, which is part of the broader bullish pattern. The next higher degree, gray wave 3, will likely push the market higher once the correction concludes.

The invalidation level for this wave count is set at 4495. As long as the Euro Stoxx 50 index remains above this level, the current analysis remains valid, and the market is expected to continue moving upward.

Summary:
The Euro Stoxx 50 is in a corrective phase (gray wave 2) within a larger uptrend. Once the correction ends, the market is expected to rise in orange wave 3. The analysis remains valid as long as the index stays above the 4495 level.

Euro-Stoxx-50-Index-...


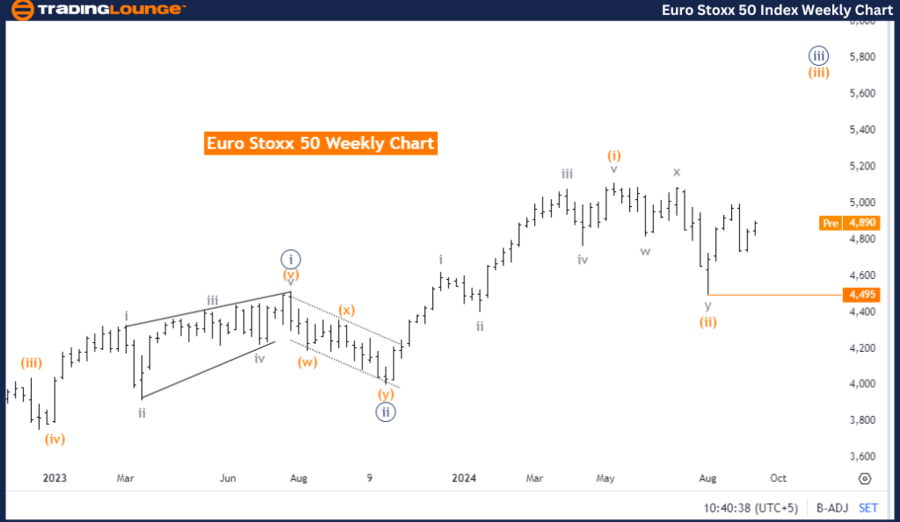
Euro Stoxx 50 Elliott Wave Analysis - Trading Lounge Weekly Chart

Euro Stoxx 50 Elliott Wave Technical Analysis

  • Function: Bullish Trend

  • Mode: Impulsive

  • Structure: Orange Wave 3

  • Position: Navy Blue Wave 3

  • Next Lower Degree: Orange Wave 4

  • Wave Cancel Invalid Level: 4495

The weekly Elliott Wave analysis for the Euro Stoxx 50 points to a bullish trend, indicating a strong upward market movement. The current wave mode is impulsive, meaning the market is advancing in line with a broader uptrend.

The key wave under analysis is orange wave 3, a significant upward wave within the impulsive structure. With orange wave 2 now considered complete, the market is advancing through orange wave 3 of 3, which is typically one of the most powerful waves in the Elliott Wave structure.

At this point, the market is positioned in navy blue wave 3, which reinforces the ongoing impulsive move. After wave 3 concludes, a corrective phase (orange wave 4) may begin, but for now, the focus remains on wave 3, which is driving the market upward.

The wave count becomes invalid if the index falls below 4495. As long as the Euro Stoxx 50 index stays above this level, the current analysis remains intact, and the bullish trend is expected to continue.

Summary:
The Euro Stoxx 50 is in an impulsive bullish phase, with orange wave 3 leading the market higher. Orange wave 2 has finished, and orange wave 3 is in progress, suggesting further upside potential. The analysis remains valid as long as the index stays above the 4495 level. A corrective phase (orange wave 4) may follow after wave 3 concludes.

Technical Analyst: Malik Awais

Source: visit Tradinglounge.com and learn From the Experts Join TradingLounge Here 

Previous: NIFTY 50 Elliott Wave Technical Analysis 

VALUE Offer - Buy 1 Month & Get 3 Months!Click here

Access 7 Analysts Over 200 Markets Covered. Chat Room With Support

Euro-Stoxx-50-Index-...

Related

British Pound/Japanese Yen(GBPJPY) Forex Elliott Wave Technical Analysis

British Pound/Japanese Yen(GBPJPY) Forex Elliott Wave Technical Analysis

The GBPJPY Elliott Wave Analysis, through its meticulous examination of both daily and 4-hour charts...

Read More >
Market Update: Preparing for the Next Trade Setup

Market Update: Preparing for the Next Trade Setup

Most stocks are approaching the final stages of their Impulse, currently in Wave iv) within Wave 1. ...

Read More >
IBEX 35 Technical Analysis Using Elliott Wave Shows Bullish Momentum, Investment Outlook, and Trading Strategy Insights

IBEX 35 Technical Analysis Using Elliott Wave Shows Bullish Momentum, Investment Outlook, and Trading Strategy Insights

Elliott Wave analysis of the IBEX 35 index, highlighting its current bullish trend. Learn about wave...

Read More >
Elliott Wave Analysis for Theta Token Against the U.S. Dollar (THETAUSD): A Comprehensive Daily and H4 Chart Review

Elliott Wave Analysis for Theta Token Against the U.S. Dollar (THETAUSD): A Comprehensive Daily and H4 Chart Review

This article provides an in-depth Elliott Wave analysis of Theta Token against the U.S. dollar (THET...

Read More >
Reliance Industries Stocks Elliott Wave Technical Analysis: Insights into Daily and 4-Hour Charts and Long-Term Market Outlook

Reliance Industries Stocks Elliott Wave Technical Analysis: Insights into Daily and 4-Hour Charts and Long-Term Market Outlook

This article provides a Technical analysis of Reliance Industries using the Elliott Wave theory. It ...

Read More >
U.S.Dollar/Japanese Yen(USDJPY) Forex - Elliottwave Technical analysis

U.S.Dollar/Japanese Yen(USDJPY) Forex - Elliottwave Technical analysis

Elliott Wave analysis of the USDJPY currency pair, providing traders with a detailed forecast and in...

Read More >

$1 for 2 Weeks

then $29 a month!

What a Special Offer!

Trade Recommendations

Unleash the power of deversified trading with our comprehensive portfolio, covering 250+ markets:

  • Stock Trades
  • Crypto Trades
  • Forex Trades
  • Commodity Trades
Elliott Wave Analysis

Gain a competitive edge with expert insights and AI-powered Elliott Wave charting into:

  • Global Indices
  • US Stocks & ASX Stocks
  • Forex & Crypto
  • Commodities
Top-Notch Trading Tools

Equip yourself with the tools of success:

  • Real-time Chat rooms
  • Elliott Wave Algorithm
  • Portfolio tools
  • TradingLevels
  • Screener
  • Trading Game
7 Elliott Wave Analysts

Stay ahead of the market with daily charts and insightful videos
Your secret to strategic trading!

JOIN HERE


Welcome to TradingLounge (ASIC A.R.No. 321187), specialists in trades, trading education and technical analysis, covering stocks, indices, commodities, forex and cryptocurrencies.

When you join TradingLounge you have access to everything we offer, including trade tools, educational content and a social platform to chat with like-minded investors.

Read more

@Copyright 2024 by tradinglounge.com

Contact Us

Australian no: 02 4787 6020

International no: +61 (2) 47876020

Pay with:

Find us on