TradingLounge ASX Wisetech Global Limited (WTC) Stock Analysis (1D Chart)
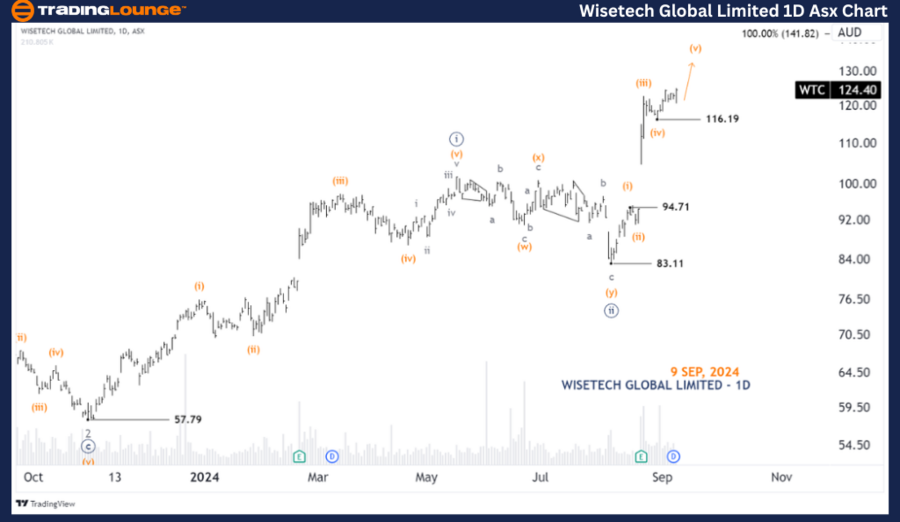
Greetings, today's Elliott Wave Analysis provides an updated outlook for Wisetech Global Limited (ASX: WTC). Based on our current assessment, WTC. ASX may be initiating a higher move, supported by a potential ((iii))-navy wave.
ASX: Wisetech Global Limited - WTC 1D Chart (Semilog Scale) Analysis
WTC Elliott Wave Technical Analysis
Function: Major trend (Minor degree, grey)
Mode: Motive
Structure: Impulse
Position: Wave ((iii))-navy of Wave 3-grey of Wave (3)-orange of Wave ((1))-navy
Details: Wave ((iii))-navy is progressing upward, aiming for a high of 146.44. The price needs to stay above 116.19 to sustain this outlook.
Invalidation point: 116.19

ASX: Wisetech Global Limited - WTC 4-Hour Chart Analysis
Function: Major trend (Minute degree, navy)
Mode: Motive
Structure: Impulse
Position: Wave (v)-orange of Wave ((iii))-navy
Details: It appears that Wave (iv)-orange concluded at 120.59, and Wave (v)-orange is currently unfolding upwards. It is subdividing into Wave iii-grey, with a potential target high of 150.00. The price needs to stay above 120.59 to maintain this projection.
Invalidation point: 120.59
Technical Analyst: Hua (Shane) Cuong, CEWA-M (Master’s Designation).
Source: visit Tradinglounge.com and learn From the Experts Join TradingLounge Here
See Previous: Commonwealth Bank of Australia - CBA Elliott Wave Technical Analysis
Special Trial Offer - 0.76 Cents a Day for 3 Months! Click here
Access 7 Analysts Over 200 Markets Covered. Chat Room With Support

Conclusion:
Our Elliott Wave analysis for ASX: WISETECH GLOBAL LIMITED - WTC provides a comprehensive view of the ongoing market trends. We highlight critical price levels to watch, which serve as validation or invalidation points for the current wave count. These levels help increase confidence in our outlook. By integrating these factors, we aim to offer an objective and professional analysis of market movements.