07Jan

ASX: GOODMAN GROUP (GMG) Elliott Wave Technical Analysis – Invalidation Points, and Actionable Stock Market Insights

ASX: GOODMAN GROUP – GMG Elliott Wave Technical Analysis TradingLounge

Greetings! This Elliott Wave analysis focuses on the Australian Stock Exchange (ASX) GOODMAN GROUP – GMG. Our assessment suggests ASX:GMG is trending lower with wave (iv)-orange and may potentially advance higher with wave (v)-orange. The report highlights key points to identify when a bullish trend begins or a bearish trend becomes invalid.


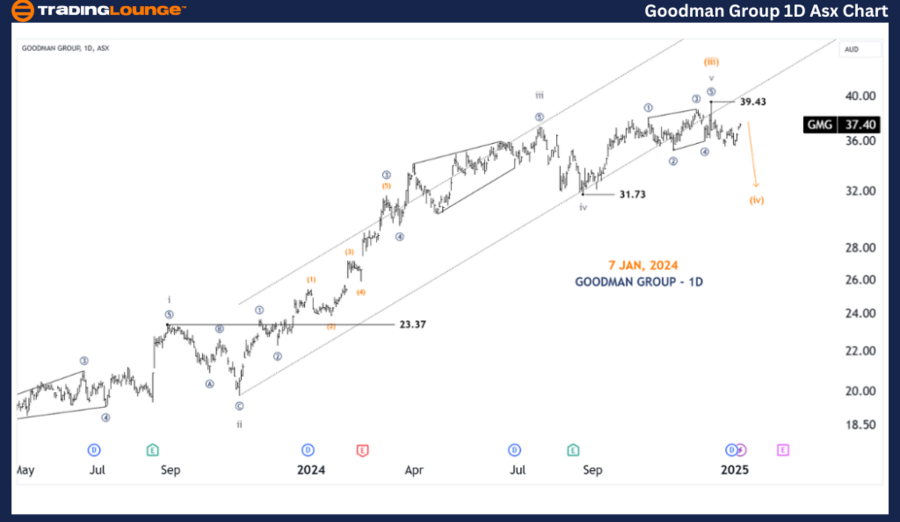
ASX: GOODMAN GROUP – GMG 1D Chart (Semilog Scale) Analysis

Function: Major Trend (Subminuette degree, grey)

Mode: Motive

Structure: Impulse

Position: Wave (iv)-orange

Details:

  • Wave (iii)-orange appears to have completed.
  • Wave (iv)-orange is unfolding downward, with a potential target near 31.73.
  • A movement above 39.43 will require reevaluation of the bearish outlook.

Key Points:

  • Target Area: Around 31.73 for wave (iv)-orange.
  • Invalidation Point: 39.43.
  • Bullish Signal: Price action above 39.43.

GOODMAN-GROUP-1d-asx...


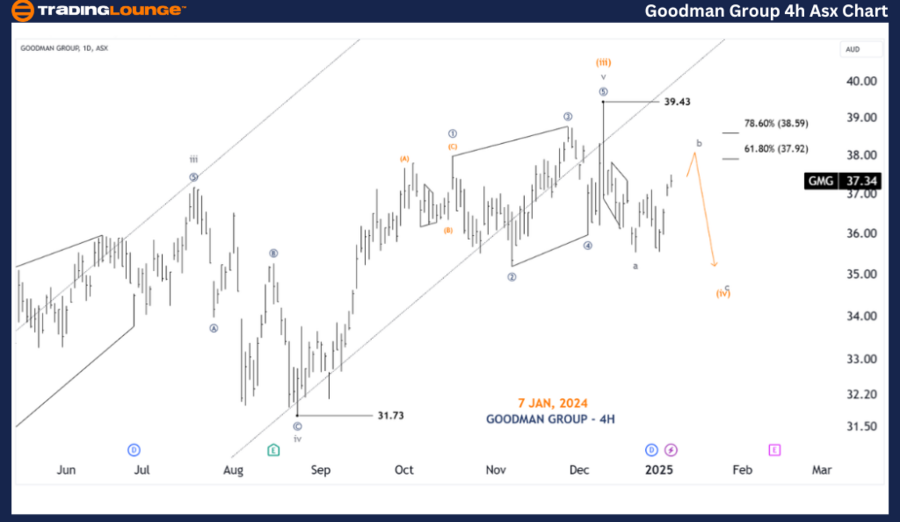
ASX: GOODMAN GROUP – GMG 4-Hour Chart Analysis

Function: Major Trend (Subminuette degree, grey)

Mode: Motive

Structure: Impulse

Position: Wave b-grey of Wave (iv)-orange

Details:

  • The 4-hour chart remains consistent with the 1D chart analysis.
  • Wave (iv)-orange continues downward, with wave b-grey advancing slightly higher.
  • Expectation of wave c-grey completing the corrective phase within wave (iv)-orange.

Key Points:

  • Target Area: Continuation of downward trend within wave (iv)-orange.
  • Invalidation Point: 39.43.

Technical Analyst: Hua (Shane) Cuong, CEWA-M (Master’s Designation).

Source: visit Tradinglounge.com and learn From the Experts Join TradingLounge Here 

See Previous: ASX: FORTESCUE LTD – FMG Elliott Wave Technical Analysis

VALUE Offer - Buy 1 Month & Get 3 Months!Click here

Access 7 Analysts Over 200 Markets Covered. Chat Room With Support

GOODMAN-GROUP-4h-asx...


Conclusion

This Elliott Wave analysis offers actionable insights into ASX: GOODMAN GROUP – GMG market trends. By providing specific validation and invalidation price points, our outlook aims to enhance trading confidence. The focus remains on identifying short-term opportunities while maintaining an objective, professional perspective on broader market trends.

Related

Elliott WaveTechnical Analysis of Iron Ore Market: SGX TSI Index Insights, Price Trends, Technical Forecasts, and Key Market Dynamics

Elliott WaveTechnical Analysis of Iron Ore Market: SGX TSI Index Insights, Price Trends, Technical Forecasts, and Key Market Dynamics

This article offers a comprehensive Elliott Wave analysis of the iron ore market, focusing on price ...

Read More >
ARK Israel Innovative Technology ETF – IZRL Elliott Wave Technical Analysis Reveals Key Levels, Price Forecast, Trading Strategy

ARK Israel Innovative Technology ETF – IZRL Elliott Wave Technical Analysis Reveals Key Levels, Price Forecast, Trading Strategy

Elliott Wave technical analysis of the ARK Israel Innovative Technology ETF (IZRL), covering both da...

Read More >
GBPUSD Elliott Wave Technical Analysis: Insights on Bearish Trends, Impulse Waves, Key Levels, and Effective Forex Trading Strategies

GBPUSD Elliott Wave Technical Analysis: Insights on Bearish Trends, Impulse Waves, Key Levels, and Effective Forex Trading Strategies

This article provides a detailed GBPUSD Elliott Wave analysis focusing on bearish trends and impulsi...

Read More >
NEOUSD Crypto Price News Today - Elliott Wave Technical Analysis

NEOUSD Crypto Price News Today - Elliott Wave Technical Analysis

This guide offers an in-depth Elliott Wave analysis of NEO/USD, providing traders and investors with...

Read More >
BTCUSD Elliott Wave Analysis: Corrective Zigzag Pattern Unfolds - TradingLounge Insights 7 February 24

BTCUSD Elliott Wave Analysis: Corrective Zigzag Pattern Unfolds - TradingLounge Insights 7 February 24

Discover insights into BTCUSD Elliott Wave Analysis dated 7 February 24 by TradingLounge, delving in...

Read More >
Kotak Mahindra Bank – KOTAKBANK Stocks Elliott Wave Technical Analysis with Chart Insights, and Potential Future Movements

Kotak Mahindra Bank – KOTAKBANK Stocks Elliott Wave Technical Analysis with Chart Insights, and Potential Future Movements

Explore the comprehensive analysis of Kotak Mahindra Bank's stock with Elliott Wave theory. Lear...

Read More >

Buy 1 Month

Get 3 Months!

Special Offer:

Trade Recommendations

Unleash the power of deversified trading with our comprehensive portfolio, covering:

  • Stock Trades
  • Crypto Trades
  • Forex Trades
  • Commodity Trades
Elliott Wave Analysis

Gain a competive edge with expert insights in to:

  • Global Indices
  • US Stocks & ASX Stocks
  • Forex & Crypto
  • Commodities
Top-Notch Trading Tools

Equip yourself with the tools of success:

  • Social Chat
  • Elliott Wave Algorithm
  • Screener
  • TradingLevels
  • Trading Game
7 Elliott Wave Analysts

Stay ahead of the market with daily charts and insightful videos
-Your secret to strategic trading!

JOIN HERE


Welcome to TradingLounge (ASIC A.R.No. 321187), specialists in trades, trading education and technical analysis, covering stocks, indices, commodities, forex and cryptocurrencies.

When you join TradingLounge you have access to everything we offer, including trade tools, educational content and a social platform to chat with like-minded investors.

Read more

@Copyright 2024 by tradinglounge.com

Contact Us

Australian no: 02 4787 6020

International no: +61 (2) 47876020

Pay with:

Find us on