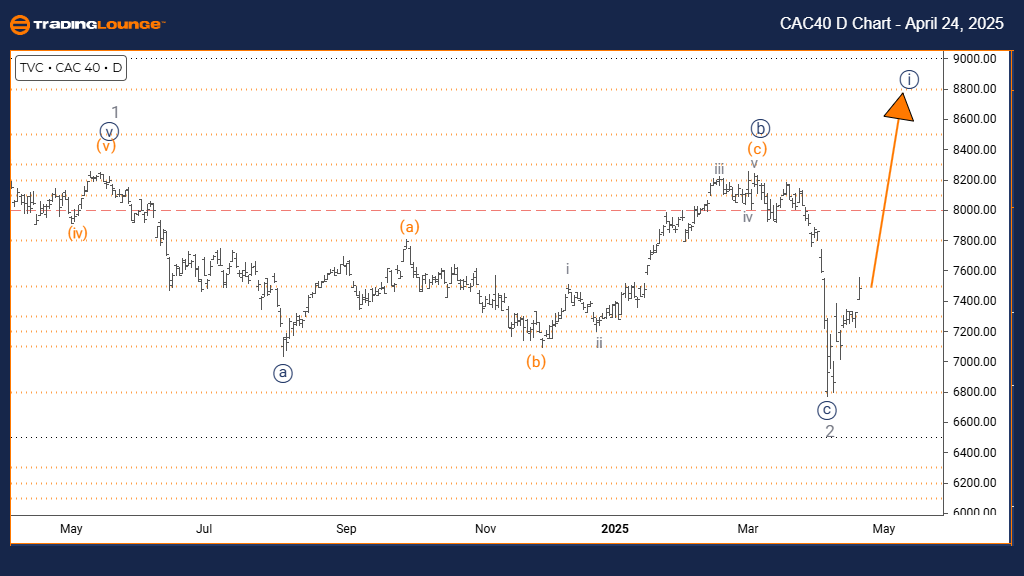
CAC 40 (France) Elliott Wave Analysis – TradingLounge Day Chart
CAC 40 (France) Day Chart Analysis
CAC 40 (France) Wave Technical Analysis
FUNCTION: Bullish Trend
MODE: Impulsive
STRUCTURE: Navy blue wave 1
POSITION: Gray wave 3
DIRECTION NEXT HIGHER DEGREES: Navy blue wave 1 (in progress)
DETAILS: Gray wave 2 appears complete. Now navy blue wave 1 of 3 is developing.
The CAC 40 Index daily Elliott Wave analysis signals the emergence of a bullish impulsive trend, with gray wave 2 completed and navy blue wave 1 of 3 now unfolding. This development initiates a new upward wave sequence, suggesting a potential rally phase in the French stock market.
Navy blue wave 1 marks the start of this rising impulse leg, often characterized by building momentum and increased market confidence. The completion of gray wave 2’s corrective structure lays the groundwork for this current upward move. Although early-stage impulses can be moderate, they typically set the tone for a sustained bullish narrative.
As gray wave 3 progresses, stronger upward price action is expected, making the ongoing navy blue wave 1 a pivotal moment for entering long positions. The chart structure supports this outlook, with further gains anticipated as the impulsive formation matures.
Technical traders should closely monitor the progression of navy blue wave 1, identifying key bullish signals such as higher volume and steady price advances. While wave 1 is generally less explosive than wave 3, it provides early positioning advantages in an unfolding bullish cycle.
Looking ahead, navy blue wave 2 is expected once wave 1 completes. This corrective phase could present a strategic buying opportunity before wave 3 of 3 initiates a stronger upward leg. Watch price structure and momentum indicators closely to validate this transition and confirm the ongoing wave count.
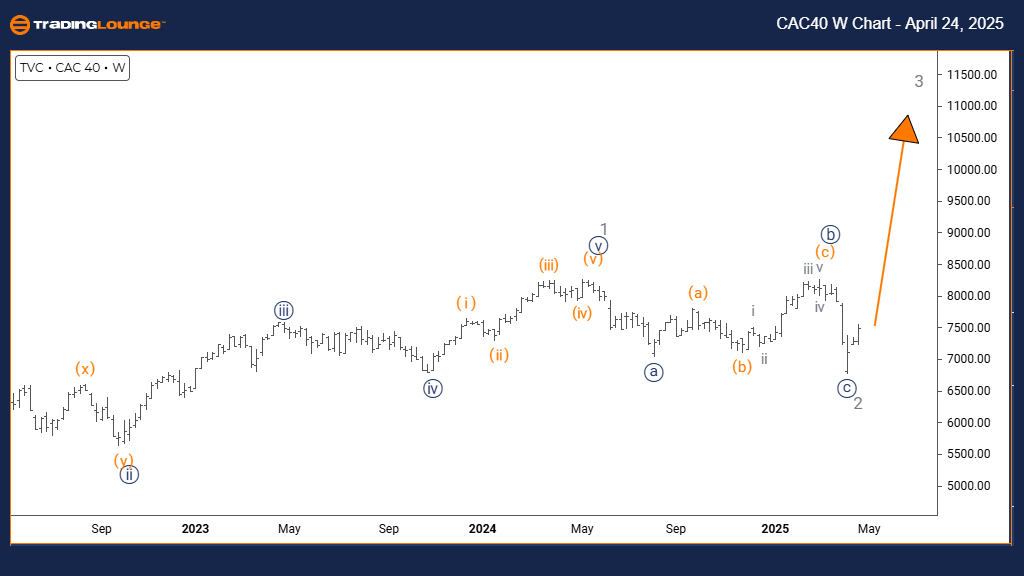
CAC 40 (France) Elliott Wave Analysis – TradingLounge Weekly Chart
CAC 40 (France) Wave Technical Analysis
FUNCTION: Bullish Trend
MODE: Impulsive
STRUCTURE: Gray wave 3
POSITION: Orange wave 1
DIRECTION NEXT HIGHER DEGREES: Gray wave 3 (in progress)
DETAILS: Gray wave 2 appears complete. Now gray wave 3 is underway.
The CAC 40 Index weekly Elliott Wave analysis highlights a strong bullish impulsive trend, with gray wave 2 concluded and gray wave 3 now active. Positioned within a larger orange wave 1 framework, this development marks a high-probability rally phase in the broader French equity market.
Gray wave 3 is historically the most dynamic wave in the Elliott sequence, often generating the sharpest and most sustained price increases. Following the completion of the prior correction, this current phase sets the stage for significant upside potential.
The weekly timeframe confirms the strength and structure of the unfolding move, offering long-term clarity for bullish traders. The start of orange wave 1 at a higher degree aligns with a broader market advance, reinforcing the bullish case.
Gray wave 3 typically exhibits strong volume trends and persistent price acceleration—critical indicators for traders to watch. This phase favors trend-following strategies, with optimal trade setups likely to emerge during intrawave pullbacks.
Once gray wave 3 concludes, a corrective gray wave 4 is expected. This retracement may provide additional buying opportunities ahead of the final leg of the impulse cycle. Monitoring technical indicators and chart structure is essential to navigate this phase effectively.
This current Elliott Wave setup offers a compelling bullish trading opportunity on both short and long-term horizons, especially for those seeking to align with the dominant trend and maximize gains from early entries.
Technical Analyst: Malik Awais
Source: Visit Tradinglounge.com and learn from the Experts. Join TradingLounge Here
Previous: TASI INDEX Elliott Wave Technical Analysis
VALUE Offer - Buy 1 Month & Get 3 Months!Click here
Access 7 Analysts Over 200 Markets Covered. Chat Room With Support