Bovespa Index Elliott Wave Forecast | Trading Lounge Daily Chart
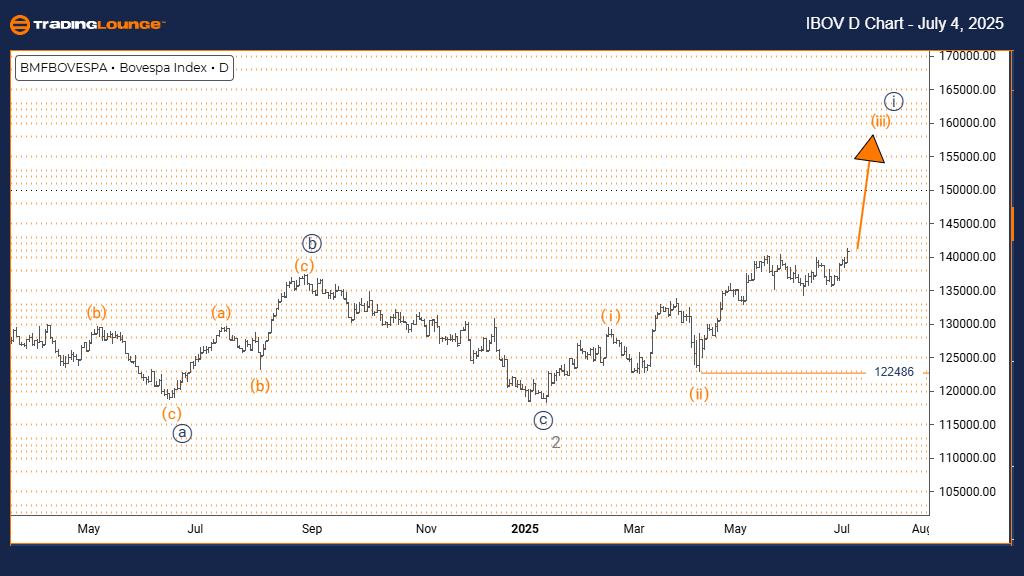
Bovespa Index – Daily Chart Analysis
Bovespa Index Elliott Wave Technical Analysis
Function: Bullish Momentum
Mode: Impulsive Wave
Structure: Developing Orange Wave 3
Position: Forming Navy Blue Wave 1
Next Wave Direction (Lower Degree): Anticipating Orange Wave 4
Key Insight: Orange Wave 2 Completed; Orange Wave 3 Expanding
Invalidation Level: 122,486
The Bovespa Index daily chart continues to show a bullish Elliott Wave structure. The current price movement is unfolding within orange wave 3, part of the broader navy blue wave 1. This setup indicates a strong uptrend and a positive outlook in the early stages of a new bullish market phase.
Following the completion of orange wave 2, the market has entered orange wave 3, which is often the most extended and forceful wave in an Elliott sequence. The next expected move is a corrective orange wave 4, which will likely follow once wave 3 reaches its peak.
Traders should monitor the invalidation level at 122,486. A drop below this level would challenge the current wave count. While the index holds above this point, the Elliott Wave pattern supports continued bullish price action with upside potential.
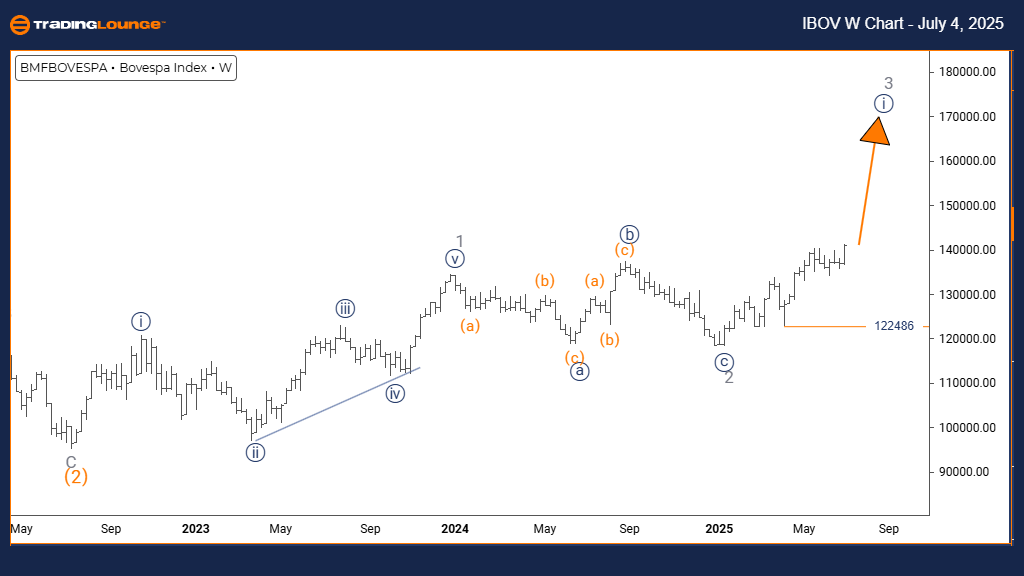
Bovespa Index Elliott Wave Analysis – Tradinglounge Weekly Chart
Bovespa Index Elliott Wave Technical Analysis
Function: Bullish Outlook
Mode: Impulsive Phase
Structure: Building Navy Blue Wave 1
Position: Within Gray Wave 3
Next Wave Direction (Lower Degree): Navy Blue Wave 2 Expected
Key Insight: Gray Wave 2 Completed; Navy Blue Wave 1 Emerging
Invalidation Level: 122,486
The weekly Bovespa Index chart maintains a bullish Elliott Wave configuration, with the index currently progressing within navy blue wave 1, part of the broader gray wave 3 sequence. This move represents the initial stage of a possible medium-to-long-term rally.
After confirming the end of gray wave 2, the development of navy blue wave 1 suggests increased buying activity and momentum. As part of the early stages of gray wave 3, this structure typically marks one of the strongest legs in Elliott Wave theory.
The key level remains the wave invalidation mark at 122,486. Staying above this point supports the bullish setup. Investors should stay alert for continued upside potential as this Elliott Wave pattern plays out, possibly leading to longer-term price appreciation.
Technical Analyst: Malik Awais
Source: Visit Tradinglounge.com and learn from the Experts. Join TradingLounge Here
Previous: IBEX 35 Index Elliott Wave Technical Analysis
VALUE Offer - $1 for 2 Weeks then $29 a month!Click here
Access 7 Analysts Over 200 Markets Covered. Chat Room With Support