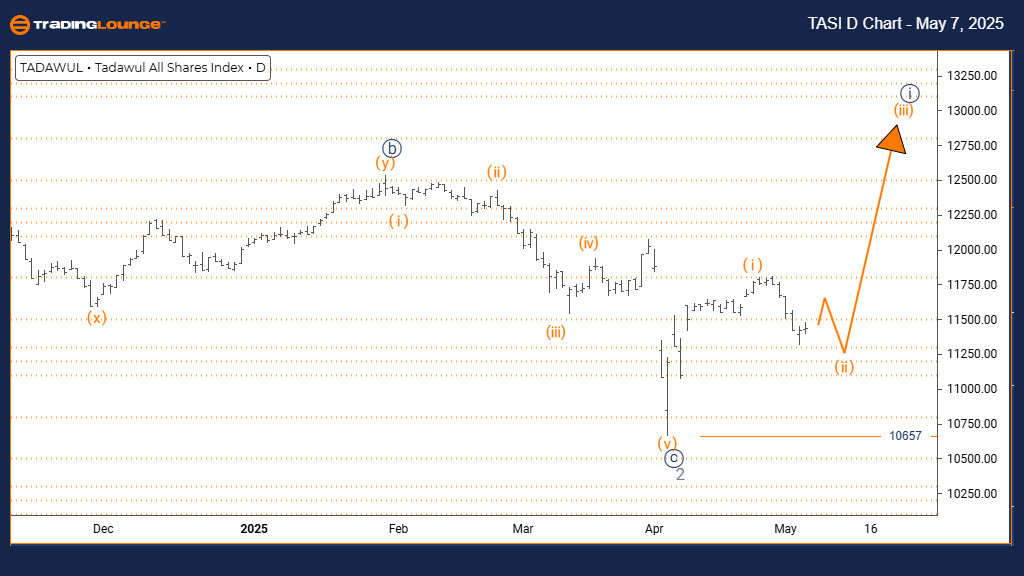
TASI INDEX - Elliott Wave Analysis - Trading Lounge Day Chart
TASI INDEX Wave Technical Analysis
FUNCTION: Counter-Trend
MODE: Corrective
STRUCTURE: Orange Wave 2
POSITION: Navy Blue Wave 1
DIRECTION NEXT HIGHER DEGREES: Orange Wave 3
DETAILS: Orange Wave 1 appears completed; Orange Wave 2 currently active.
Wave Cancel/Invalid Level: 10657
The TASI INDEX daily chart reveals a counter-trend correction within a larger bullish trend. After completing the Orange Wave 1 advance, the index has entered the Orange Wave 2 correction, positioned inside the broader Navy Blue Wave 1 uptrend. This setup suggests a temporary decline before the primary upward trend resumes.
Orange Wave 2 marks the correction phase, typically retracing between 38% and 61% of Wave 1’s movement. It usually forms corrective patterns like zigzags or flats. The completion of the strong Orange Wave 1 move sets the background for this pullback, which often shows overlapping price action and weaker momentum. The daily chart indicates this is likely an intermediate pause within a broader bullish pattern.
The next expected move is the upward advance of Orange Wave 3 after Orange Wave 2 concludes. Wave 3 generally delivers the strongest gains, often exceeding the previous Wave 1 peak. Traders must monitor the 10657 level closely, as a break below it would invalidate the current Elliott Wave setup.
Market participants should watch for classic end-of-correction signals, such as bullish candlestick patterns or momentum indicators reaching oversold areas. This correction presents strategic opportunities to prepare for the bullish Wave 3. Technical analysis tools will help confirm the transition from Wave 2 to Wave 3.
This corrective phase reflects a normal consolidation within the overall uptrend, offering traders an early entry window into the next bullish leg. Observing key Fibonacci retracement levels and price action patterns will be important for timing entries as the market shifts from Orange Wave 2 to Orange Wave 3. The daily chart highlights the importance of this phase in the broader bullish outlook.
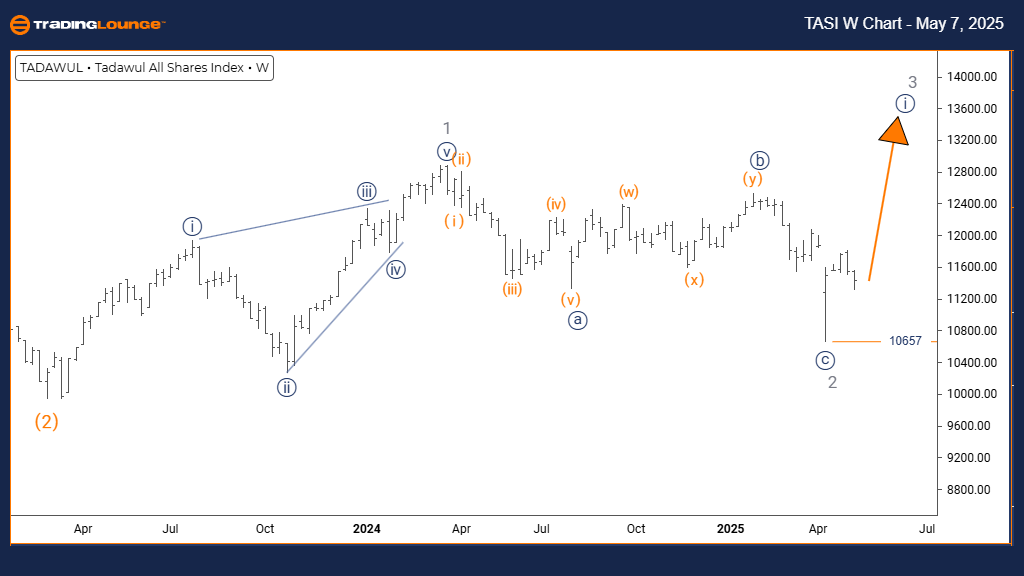
TASI INDEX - Elliott Wave Analysis - Trading Lounge Weekly Chart
TASI INDEX Wave Technical Analysis
FUNCTION: Bullish Trend
MODE: Impulsive
STRUCTURE: Navy Blue Wave 1
POSITION: Gray Wave 3
DIRECTION NEXT LOWER DEGREES: Navy Blue Wave 2
DETAILS: Gray Wave 2 likely completed; Navy Blue Wave 1 of 3 underway.
Wave Cancel/Invalid Level: 10657
The TASI INDEX weekly chart displays a strong bullish trend unfolding within an impulsive Elliott Wave structure. After completing the Gray Wave 2 correction, the index has started Navy Blue Wave 1 within the broader Gray Wave 3. This early-stage setup hints at a significant upward move building over the coming weeks.
Navy Blue Wave 1 signals the beginning of the impulse phase, often accompanied by steady price increases as momentum grows. The conclusion of Gray Wave 2 created conditions favorable for this move, which often starts slowly but strengthens over time. The weekly chart supports the view of an emerging intermediate-term uptrend.
This wave structure suggests that the TASI INDEX is progressing into a potential Gray Wave 3, with Navy Blue Wave 1 laying the foundation. Typically, Wave 3 brings stronger and more sustained bullish behavior. Traders should look for early indicators, such as stronger technical signals and higher trading volumes.
Once Navy Blue Wave 1 finishes, the index is expected to correct into Navy Blue Wave 2 before resuming the upward trend. The weekly chart emphasizes the critical nature of this developing pattern and the importance of monitoring price action and momentum indicators. This analysis points to a potential strong trend formation that could favor trend-following strategies.
A critical level to watch remains 10657. A break below this point would require a reevaluation of the current bullish scenario. Traders should stay prepared for bullish setups following the anticipated Navy Blue Wave 2 correction, keeping in mind that Wave 3 often provides the most powerful price movements.
Technical Analyst: Malik Awais
Source: Visit Tradinglounge.com and learn from the Experts. Join TradingLounge Here
Previous: KOSPI Composite Elliott Wave Technical Analysis
VALUE Offer - Buy 1 Month & Get 3 Months!Click here
Access 7 Analysts Over 200 Markets Covered. Chat Room With Support