29Nov

Elliott Wave Technical Analysis of DR. REDDY’S LABORATORIES: Key Levels, Stock Trends, Forecasts, and Actionable Insights for Traders

DR REDDY'S LABORATORIES – DRREDDY (1D Chart) Elliott Wave Technical Analysis

DRREDDY Elliott Wave Technical Analysis

Function: Larger Degree Trend Higher (Minor degree, Grey)

Mode: Motive

Structure: Impulse

Position: Minor Wave 4

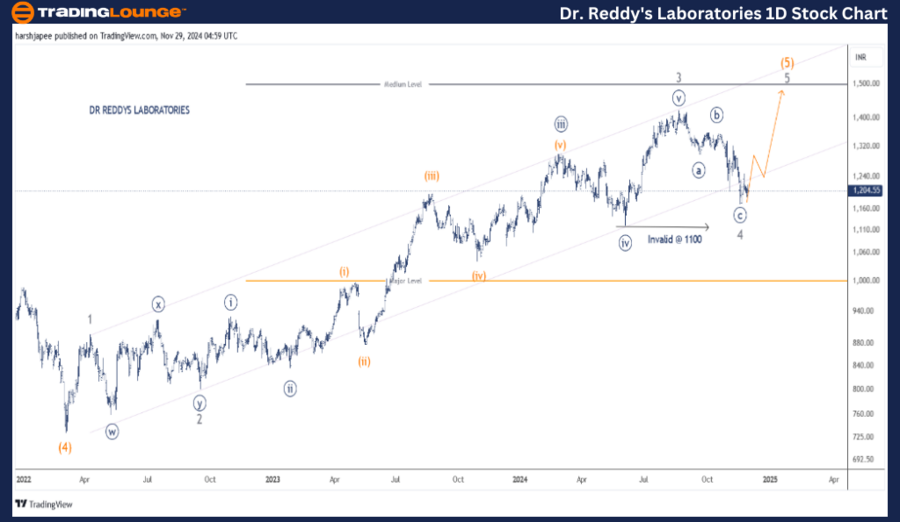
Details: The structure appears to have shifted, as the Zigzag correction seems complete around the 1150–1160 mark. If this analysis holds, Minor Wave 5 is expected to be underway against the 1100 invalidation point.

Invalidation Point: 1100

DR. REDDY’S LABORATORIES Daily Chart Technical Analysis and Potential Elliott Wave Counts

The daily chart of DR. REDDY’S LABORATORIES suggests a continuation of the larger degree uptrend as long as prices stay above the critical 1100 level. Minor Wave 5 of Intermediate Wave (5) Orange is potentially unfolding. However, a sustained break below the 1100 mark would necessitate a revision of the Elliott Wave counts.

Previously, the stock experienced a significant decline, bottoming out at 730, marking the termination of Intermediate Wave (4). From that point, an impulse wave appears to be progressing. Minor Waves 1 through 4 are already in place. Assuming this count is accurate, Minor Wave 5 is poised to resume higher shortly.

Alternate Scenario:
The stock might have completed its impulsive sequence near the 1420 mark and could now be reversing lower. A decisive break below 1100 would signal a potential major top, requiring a reassessment of the wave structure.

DR-REDDY'S-LABORATOR...


DR REDDY'S LABORATORIES – DRREDDY (4H Chart) Elliott Wave Technical Analysis

Function: Larger Degree Trend Higher (Minor degree, Grey)

Mode: Motive

Structure: Impulse

Position: Minor Wave 4

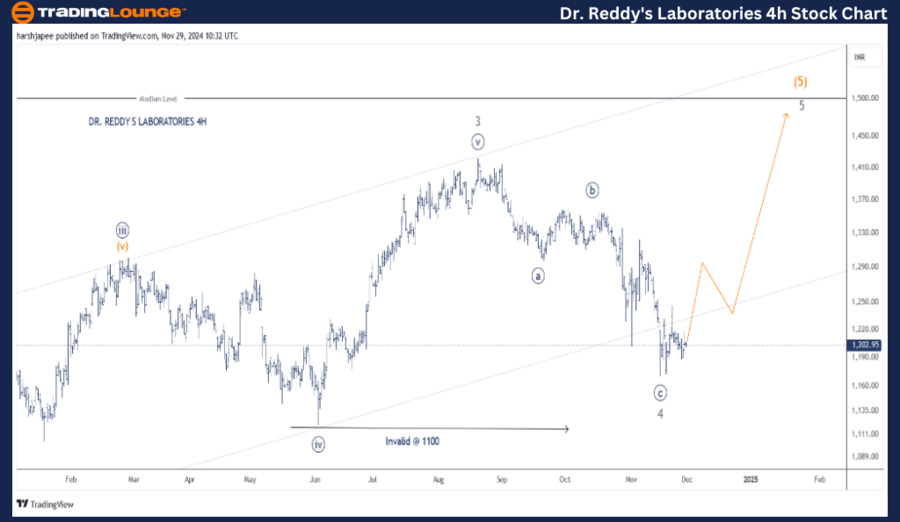
Details: The Zigzag correction on the 4H chart appears complete around the 1150–1160 zone. If accurate, Minor Wave 5 should now be progressing higher, maintaining the 1100 invalidation level.

Invalidation Point: 1100

DR. REDDY’S LABORATORIES 4H Chart Technical Analysis and Potential Elliott Wave Counts

The 4H chart of DR. REDDY’S LABORATORIES offers insights into the sub-waves post-Minor Wave 3, which peaked near 1420 in August 2024. Wave 4 unfolded as a Zigzag correction, potentially completing around 1170. However, it could form another shallow low before resuming the upward trend.

If the current structure remains intact, prices are likely to stay above the critical 1100 level, which corresponds to the prior Minor Wave ((iv)) Navy. This would set the stage for a continued rally towards and potentially beyond the 1420 level.

Technical Analyst: Harsh Japee

Source: visit Tradinglounge.com and learn From the Experts Join TradingLounge Here 

Previous: Tata Consumer Product Elliott Wave Technical Analysis 

VALUE Offer - Buy 1 Month & Get 3 Months!Click here

Access 7 Analysts Over 200 Markets Covered. Chat Room With Support

DR-REDDY'S-LABORATOR...


Conclusion

The analysis indicates that DR. REDDY’S LABORATORIES may have completed its Zigzag correction around the 1170 mark. If this interpretation is correct, Minor Wave 5 is anticipated to resume its upward trajectory shortly. For traders, the 1100 mark remains the key invalidation level, while targets near 1420 or higher could be in play.

Related

Meta Platforms Inc. Stock Price Direction and Identify Trading Opportunities With META Elliott Wave Technical Analysis

Meta Platforms Inc. Stock Price Direction and Identify Trading Opportunities With META Elliott Wave Technical Analysis

This article provides an in-depth Elliott Wave analysis for Meta Platforms Inc. (META), focusing on ...

Read More >
Cardano (ADA) Elliott Wave Analysis Shows Bullish Wave 3 Targeting $0.685 with Key Fibonacci Levels and Swing Trade Strategy

Cardano (ADA) Elliott Wave Analysis Shows Bullish Wave 3 Targeting $0.685 with Key Fibonacci Levels and Swing Trade Strategy

ADA Elliott Wave technical analysis reveals completion of Waves 1 and 2 on both daily and 4H charts....

Read More >
Unlocking ASX Trading Success: WOOLWORTHS GROUP LIMITED - WOW Stock Analysis & Elliott Wave Technical Forecast

Unlocking ASX Trading Success: WOOLWORTHS GROUP LIMITED - WOW Stock Analysis & Elliott Wave Technical Forecast

This analysis provides an in-depth Elliott Wave forecast for Woolworths Group Limited (ASX: WOW), in...

Read More >
U.S.Dollar/Canadian Dollar(USD/CAD) Elliott Wave Technical Analysis 12 December 23

U.S.Dollar/Canadian Dollar(USD/CAD) Elliott Wave Technical Analysis 12 December 23

USD/CAD Elliott Wave Analysis Trading Lounge Day Chart for 12 December 23, provides an in-depth exam...

Read More >
New Zealand Dollar/U.S.Dollar Forex Currency Pair | NZDUSD Elliott Wave Technical Analysis

New Zealand Dollar/U.S.Dollar Forex Currency Pair | NZDUSD Elliott Wave Technical Analysis

Our in-depth NZDUSD Elliott Wave analysis provides essential insights into the daily and 4-hour char...

Read More >
ASX CBA Elliott Wave Analysis: Commonwealth Bank Stock Forecast, Technical Trends & Investment Strategy for Australian Market

ASX CBA Elliott Wave Analysis: Commonwealth Bank Stock Forecast, Technical Trends & Investment Strategy for Australian Market

Our ASX: CBA Elliott Wave analysis provides a detailed stock forecast for Commonwealth Bank of Austr...

Read More >

$1 for 2 Weeks

then $29 a month!

What a Special Offer!

Trade Recommendations

Unleash the power of deversified trading with our comprehensive portfolio, covering 250+ markets:

  • Stock Trades
  • Crypto Trades
  • Forex Trades
  • Commodity Trades
Elliott Wave Analysis

Gain a competitive edge with expert insights and AI-powered Elliott Wave charting into:

  • Global Indices
  • US Stocks & ASX Stocks
  • Forex & Crypto
  • Commodities
Top-Notch Trading Tools

Equip yourself with the tools of success:

  • Real-time Chat rooms
  • Elliott Wave Algorithm
  • Portfolio tools
  • TradingLevels
  • Screener
  • Trading Game
7 Elliott Wave Analysts

Stay ahead of the market with daily charts and insightful videos
Your secret to strategic trading!

JOIN HERE


Welcome to TradingLounge (ASIC A.R.No. 321187), specialists in trades, trading education and technical analysis, covering stocks, indices, commodities, forex and cryptocurrencies.

When you join TradingLounge you have access to everything we offer, including trade tools, educational content and a social platform to chat with like-minded investors.

Read more

@Copyright 2024 by tradinglounge.com

Contact Us

Australian no: 02 4787 6020

International no: +61 (2) 47876020

Pay with:

Find us on