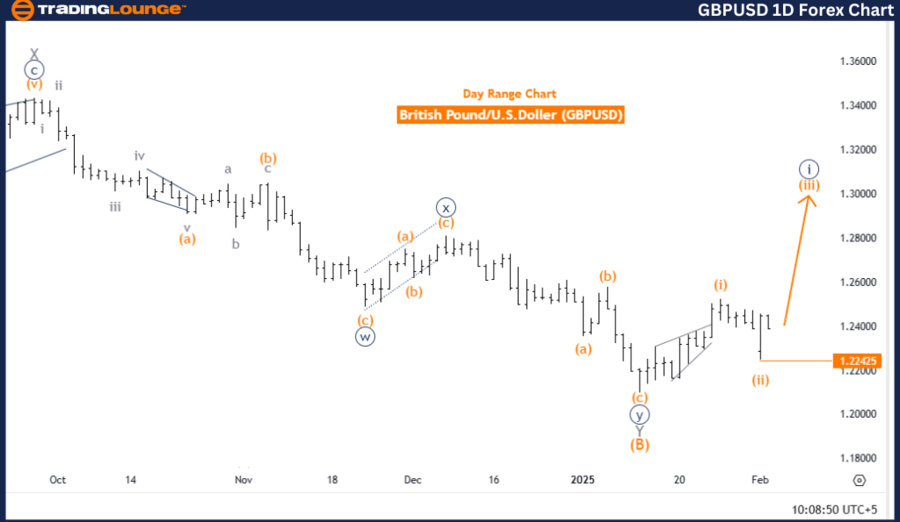
GBPUSD Elliott Wave Analysis – Trading Lounge Day Chart
British Pound/ U.S. Dollar (GBPUSD) Daily Chart Analysis
GBPUSD Elliott Wave Technical Analysis
- Function: Trend
- Mode: Impulsive
- Structure: Orange Wave 3
- Position: Navy Blue Wave 1
- Next Lower Degree Direction: Orange Wave 4
Market Outlook & Key Details
-
Orange Wave 2 of Navy Blue Wave 1 has been completed, with Orange Wave 3 now in progress.
-
Wave Cancel Invalidation Level: 1.22425
The daily Elliott Wave analysis for GBPUSD suggests a bullish trend continuation, with an impulsive wave structure reinforcing upward momentum. The focus remains on Orange Wave 3, which has begun after the completion of Orange Wave 2 within Navy Blue Wave 1. This setup signals a strong bullish push in the market.
Currently, GBPUSD is positioned in Navy Blue Wave 1, marking the early stage of a broader bullish cycle. The successful completion of Orange Wave 2 has transitioned the market into Orange Wave 3, which is typically the most powerful phase in an impulsive structure.
Looking ahead, traders should anticipate Orange Wave 4 as the next corrective phase once Orange Wave 3 is fully developed. However, for now, the focus remains on the bullish trajectory, driven by the strength of Orange Wave 3.
The wave cancel invalidation level is set at 1.22425—a break below this level would negate the current Elliott Wave count, requiring a reassessment of the market structure.
Conclusion
The daily chart analysis for GBPUSD indicates a strong bullish phase, with Orange Wave 3 actively developing within Navy Blue Wave 1. The completion of Orange Wave 2 has confirmed the start of an impulsive upward trend, which is expected to drive significant bullish momentum.
Traders should closely monitor price movements around the invalidation level to validate or adjust trading strategies accordingly. This analysis provides critical insights for navigating GBPUSD's bullish trend and preparing for potential corrections or further price advancements.
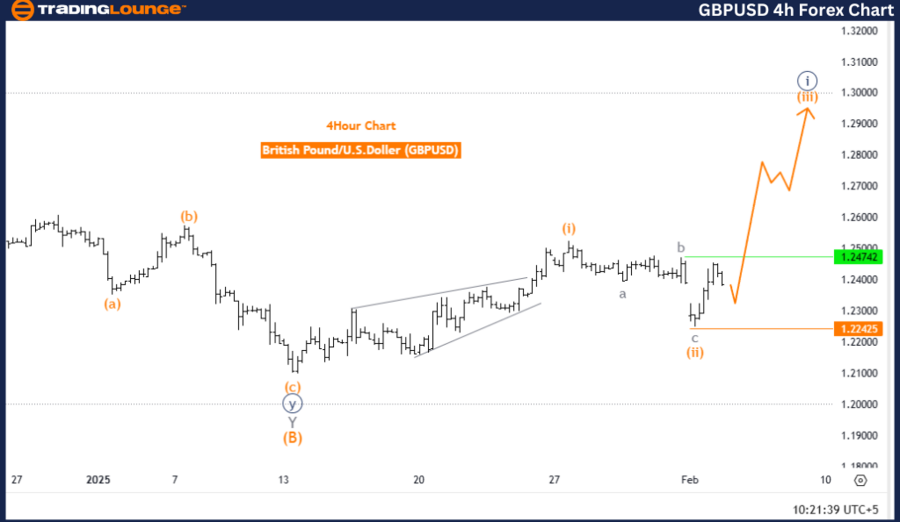
British Pound/ U.S. Dollar (GBPUSD) – 4-Hour Chart
GBPUSD Elliott Wave Technical Analysis
- Function: Bullish Trend
- Mode: Impulsive
- Structure: Orange Wave 3
- Position: Navy Blue Wave 1
- Next Higher Degree Direction: Orange Wave 3 (Started)
Market Outlook & Key Details
-
Orange Wave 2 of Navy Blue Wave 1 has been completed, with Orange Wave 3 now unfolding.
-
Wave Cancel Invalidation Level: 1.22425
The 4-hour chart analysis of GBPUSD confirms a bullish trend, characterized by an impulsive Elliott Wave structure. The key focus is on Orange Wave 3, which has begun after the completion of Orange Wave 2 within Navy Blue Wave 1. This continuation pattern suggests strong bullish momentum.
At this stage, GBPUSD is positioned in Navy Blue Wave 1, marking the initial development of a potentially extended bullish phase. The confirmed completion of Orange Wave 2 sets the stage for further price appreciation within Orange Wave 3, typically the most dominant phase in an impulsive sequence.
The wave cancel invalidation level remains at 1.22425. A price drop below this threshold would invalidate the current Elliott Wave count, requiring a technical reassessment of the market structure.
Summary
The 4-hour GBPUSD chart reflects a developing bullish trend, led by the emergence of Orange Wave 3 within Navy Blue Wave 1. The completion of Orange Wave 2 indicates a strong shift toward upward momentum, aligning with the impulsive wave structure of the Elliott Wave Theory.
Traders should monitor key price levels and use the wave cancel invalidation point as a reference for confirming or modifying trading strategies. This Elliott Wave analysis delivers valuable insights into GBPUSD's ongoing bullish trend, helping traders prepare for potential future price surges.
Technical Analyst: Malik Awais
Source: visit Tradinglounge.com and learn From the Experts Join TradingLounge Here
Previous: AUDJPY Elliott Wave Technical Analysis
VALUE Offer - Buy 1 Month & Get 3 Months!Click here
Access 7 Analysts Over 200 Markets Covered. Chat Room With Support