22Oct

Analysis Provides Insights into Coca-Cola's Stock Forecast using Elliott Wave Theory and Technical Chart Patterns

KO Elliott Wave Analysis for The Coca-Cola Company (KO)

In this Elliott Wave analysis, we will examine the trend structure of The Coca-Cola Company (KO), utilizing both daily and 1-hour charts to determine the current wave position and potential price movements.

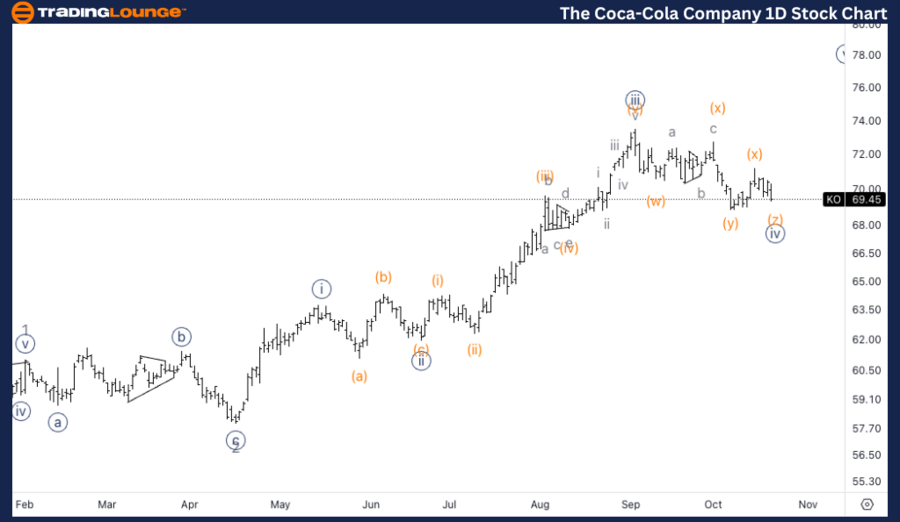
KO Elliott Wave Analysis – Trading Lounge Daily Chart

The Coca-Cola Company (KO) Daily Chart

KO Elliott Wave Technical Analysis

Function: Counter Trend

Mode: Corrective

Structure: Complex

Position: Wave {iv}

Direction: Bottom in wave {iv}

Details: We are currently observing a correction that has persisted for slightly over a month, which appears to be part of wave {iv} following a sharp impulsive wave {iii} move.

KO Elliott Wave Technical Analysis – Daily Chart

On the daily chart, The Coca-Cola Company (KO) is in the midst of a wave {iv} correction, which has lasted just over a month. This correction follows a strong impulsive move in wave {iii}. The complex structure typical of wave {iv} suggests that the correction is nearing its conclusion, setting up for the next upward movement in wave {v} once this correction is complete.

the-Coco-Cola-Compan...


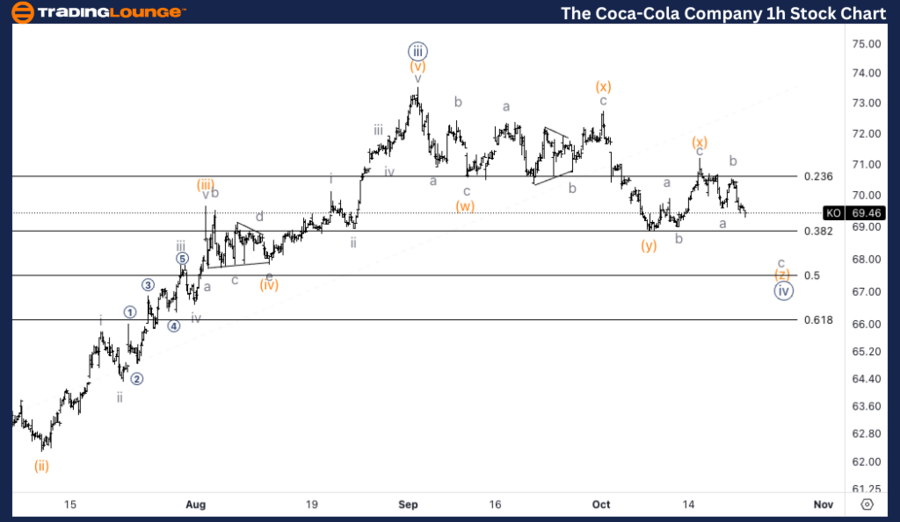
The Coca-Cola Company (KO) 1H Chart

KO Elliott Wave Technical Analysis

Function: Counter Trend

Mode: Corrective

Structure: Complex

Position: Wave (z) of {iv}

Direction: Downside in wave (z)

Details: A closer look at the corrective structure of wave {iv} shows that the most recent upward movement appears to consist of three waves, which suggests that the correction is still ongoing. Therefore, the current complex wave count seems to be the most accurate scenario at this stage.

KO Elliott Wave Technical Analysis – 1H Chart

On the 1-hour chart, the market is positioned in wave (z) of {iv}, indicating that the complex correction is still unfolding. The most recent move upward is corrective, made up of three waves, signaling that the correction is not yet complete. This complex corrective structure, likely a double or triple combination, suggests the possibility of further downside before the completion of wave {iv}. Once the correction concludes, we expect the market to resume its uptrend in wave {v}.

Technical Analyst: Alessio Barretta

Source: visit Tradinglounge.com and learn From the Experts Join TradingLounge Here 

See Previous: GOOGL Elliott Wave Technical Analysis

VALUE Offer - Buy 1 Month & Get 3 Months!Click here

Access 7 Analysts Over 200 Markets Covered. Chat Room With Support

the-Coco-Cola-Compan...

Related

Texas Instruments Inc.(TXN) Stocks Elliott Wave Technical Analysis: Daily and 4-Hour Elliott Wave Overview

Texas Instruments Inc.(TXN) Stocks Elliott Wave Technical Analysis: Daily and 4-Hour Elliott Wave Overview

This article provides an in-depth Elliott Wave analysis of Texas Instruments Incorporated (TXN), foc...

Read More >
In-Depth Elliott Wave TechnicalAnalysis for Meta Platforms Inc. (META): A Trading Perspective

In-Depth Elliott Wave TechnicalAnalysis for Meta Platforms Inc. (META): A Trading Perspective

Explore an in-depth analysis of Meta Platforms Inc. (META) through the lens of Elliott Wave theory. ...

Read More >
Axis Bank Ltd Stocks Analysis – AXISBANK Elliott Wave Technical Analysis to make informed Decisions about Bank shares

Axis Bank Ltd Stocks Analysis – AXISBANK Elliott Wave Technical Analysis to make informed Decisions about Bank shares

This article provides a detailed analysis of Axis Bank's stock using Elliott Wave theory and tec...

Read More >
An in-depth Tron Crypto Price News Today Elliott Wave Technical Analysis of the TRX/USD trading pair.

An in-depth Tron Crypto Price News Today Elliott Wave Technical Analysis of the TRX/USD trading pair.

This article provides an in-depth Elliott Wave analysis of the TRX/USD trading pair. It explores the...

Read More >
ASX:NST Elliott Wave Analysis – Northern Star Resources Stock Forecast, Key Price Levels and Trading Strategies for Smart Investors

ASX:NST Elliott Wave Analysis – Northern Star Resources Stock Forecast, Key Price Levels and Trading Strategies for Smart Investors

This in-depth Elliott Wave technical analysis for Northern Star Resources Ltd (ASX:NST) provides a m...

Read More >
Comprehensive Elliott Wave Analysis of TJX Companies Inc. with Daily and 1-Hour Chart Insights and Stock Projections

Comprehensive Elliott Wave Analysis of TJX Companies Inc. with Daily and 1-Hour Chart Insights and Stock Projections

This Elliott Wave analysis of TJX Companies Inc. (TJX) provides a detailed look at daily and 1-hour ...

Read More >

Buy 1 Month

Get 3 Months!

Special Offer:

Trade Recommendations

Unleash the power of deversified trading with our comprehensive portfolio, covering:

  • Stock Trades
  • Crypto Trades
  • Forex Trades
  • Commodity Trades
Elliott Wave Analysis

Gain a competive edge with expert insights in to:

  • Global Indices
  • US Stocks & ASX Stocks
  • Forex & Crypto
  • Commodities
Top-Notch Trading Tools

Equip yourself with the tools of success:

  • Social Chat
  • Elliott Wave Algorithm
  • Screener
  • TradingLevels
  • Trading Game
7 Elliott Wave Analysts

Stay ahead of the market with daily charts and insightful videos
-Your secret to strategic trading!

JOIN HERE


Welcome to TradingLounge (ASIC A.R.No. 321187), specialists in trades, trading education and technical analysis, covering stocks, indices, commodities, forex and cryptocurrencies.

When you join TradingLounge you have access to everything we offer, including trade tools, educational content and a social platform to chat with like-minded investors.

Read more

@Copyright 2024 by tradinglounge.com

Contact Us

Australian no: 02 4787 6020

International no: +61 (2) 47876020

Pay with:

Find us on