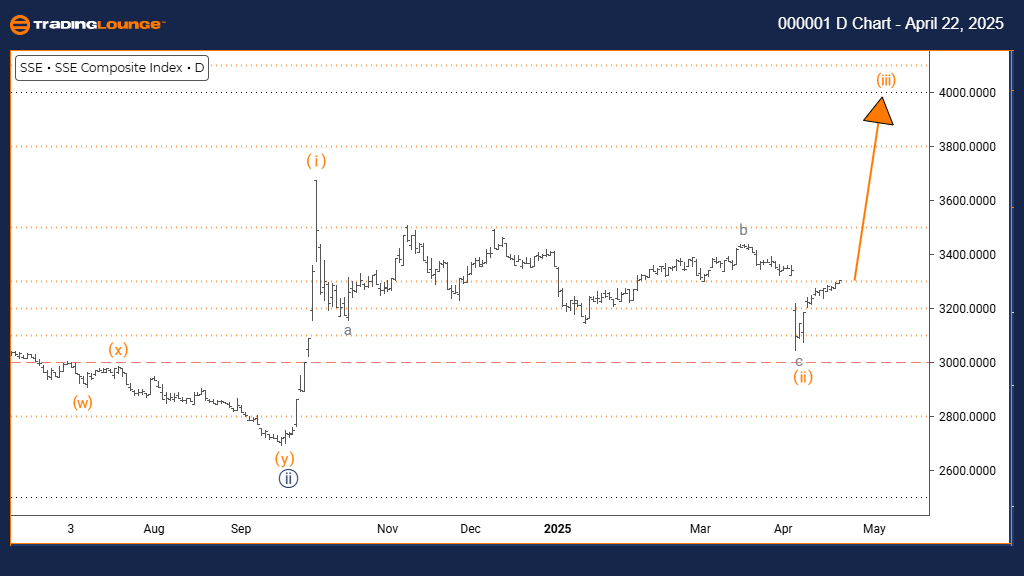
Shanghai Composite Elliott Wave Analysis – Trading Lounge Day Chart
Shanghai Composite Wave Technical Analysis
Function: Trend
Mode: Impulsive
Structure: Orange Wave 3
Position: Navy Blue Wave 3
Direction Next Higher Degrees: Orange Wave 3 (started)
Details: Orange wave 2 appears completed; orange wave 3 of 3 is now underway
The Shanghai Composite Daily Elliott Wave Forecast indicates a bullish impulsive wave structure gaining momentum. With orange wave 2 likely completed, the initiation of orange wave 3 within the broader navy blue wave 3 phase suggests a high-energy move to the upside.
Orange wave 3 is historically the most powerful part of an Elliott impulse sequence—often longer and stronger than wave 1. With the corrective structure of wave 2 behind, this phase typically brings aggressive buying and strong price expansion. The current wave count supports a continuation of this bullish momentum.
This daily chart analysis offers vital insights into the ongoing trend, forming the core of a larger Elliott Wave bullish cycle. The emergence of navy blue wave 3 highlights a probable multi-timeframe uptrend, making this a critical moment for traders seeking to ride strong directional moves.
Traders should monitor wave 3 for classic traits: persistent upward price action, increased volume, and clear trend confirmation. Remaining bullish may prove advantageous, though being alert to overbought signals and potential exhaustion is wise as the wave matures.
Once orange wave 3 concludes, a corrective orange wave 4 is expected. This will likely provide a retracement opportunity within the larger uptrend. As wave 3 often offers the best risk-to-reward scenario in Elliott structures, this current setup is ideal for trend-following strategies.
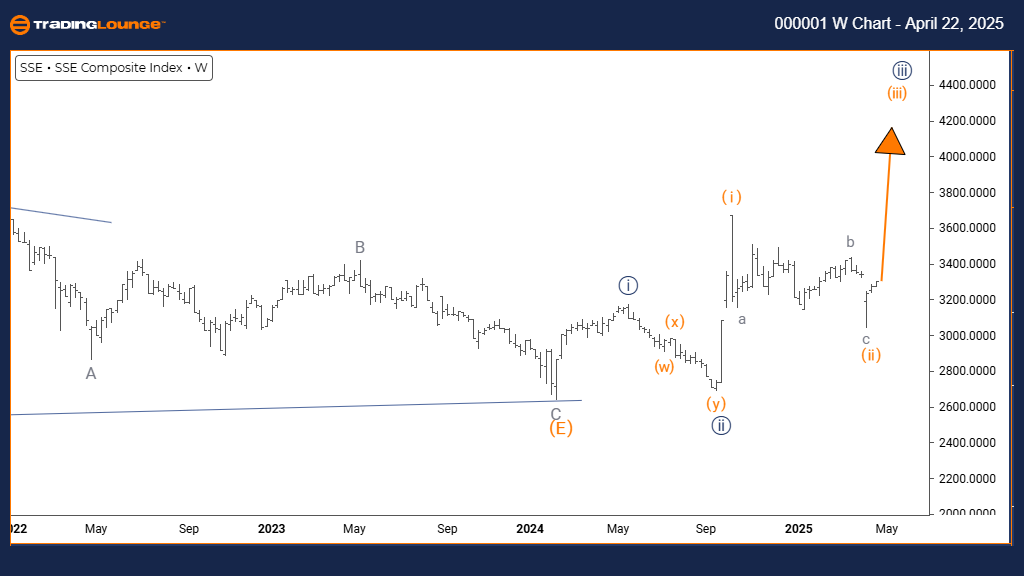
Shanghai Composite Elliott Wave Analysis – Trading Lounge Weekly Chart
Shanghai Composite Wave Technical Analysis
Function: Trend
Mode: Impulsive
Structure: Orange Wave 3
Position: Navy Blue Wave 3
Direction Next Lower Degrees: Orange Wave 4
Details: Orange wave 2 appears completed; orange wave 3 of 3 is now active
The Shanghai Composite Weekly Elliott Wave Outlook reveals a sustained impulsive rally within a broader bullish wave cycle. Following the completion of orange wave 2, the market has launched into orange wave 3 of navy blue wave 3, indicating powerful upward momentum.
Wave 3 in Elliott terms represents the most dynamic and extended phase of a trend, usually exceeding wave 1 in both duration and strength. With wave 2 behind, wave 3 is expected to unfold with increasing velocity, marking a key phase in long-term bullish development.
This weekly view provides a strategic Elliott Wave roadmap, showing the index in a robust stage of upward expansion. The advancement of navy blue wave 3 on a higher degree scale reinforces expectations for further bullish movement across multiple timeframes.
Traders should focus on wave 3 characteristics—sharp upward movement, strong volume, and trend continuation signals. Maintaining a bullish bias is suggested, but traders must also track reversal indicators that could signal the beginning of wave 4.
The next logical sequence is orange wave 4, a corrective move following the completion of this impulse. Wave 4 is expected to offer a retracement before wave 5 resumes the trend. Given that wave 3 often presents the best conditions for trend trading, this stage is considered a prime opportunity for active market participants.
Technical Analyst: Malik Awais
Source: Visit Tradinglounge.com and learn from the Experts. Join TradingLounge Here
Previous: S&P 500 Elliott Wave Technical Analysis
VALUE Offer - Buy 1 Month & Get 3 Months!Click here
Access 7 Analysts Over 200 Markets Covered. Chat Room With Support