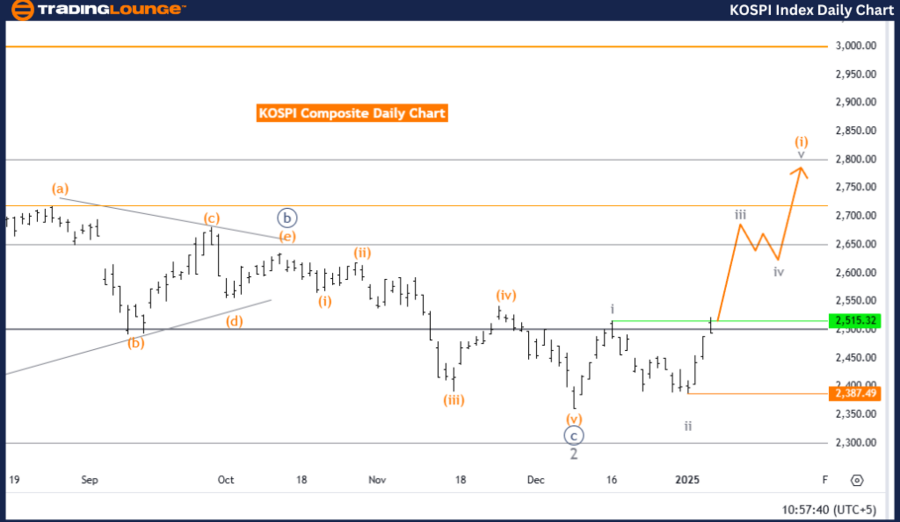
KOSPI Composite Elliott Wave Analysis - Trading Lounge Day Chart
KOSPI Composite Elliott Wave Technical Analysis
Function: Bullish Trend
Mode: Impulsive
Structure: Gray Wave 3
Position: Orange Wave 1
Direction Next Lower Degrees: Gray Wave 4
Details: Gray wave 2 appears completed; gray wave 3 of orange wave 1 is now unfolding.
Wave Cancel Invalidation Level: 2,387.49
The KOSPI Composite Index is displaying a bullish trend on the daily chart, as confirmed by Elliott Wave Analysis. The current structure indicates the emergence of an impulsive gray wave 3 within the broader orange wave 1. The conclusion of gray wave 2 has led to the active formation of gray wave 3, showcasing strong upward momentum.
The ongoing gray wave 3 is part of an impulsive sequence, highlighting robust market direction. Following the completion of gray wave 3, the market is anticipated to enter gray wave 4, which will act as a corrective phase. This aligns with the Elliott Wave principle of alternating impulsive and corrective patterns, underscoring the market's natural rhythm.
A critical invalidation level is defined at 2,387.49. A breach of this level will invalidate the current wave interpretation, necessitating a structural reassessment. This threshold is pivotal for confirming the wave count's validity and guiding strategic decision-making.
Summary:
The KOSPI Composite Index is progressing within an impulsive bullish trend, led by the development of gray wave 3 within orange wave 1. The market's upward momentum is expected to be followed by gray wave 4, a corrective phase. The invalidation level at 2,387.49 remains a crucial benchmark for maintaining the integrity of the current wave scenario.
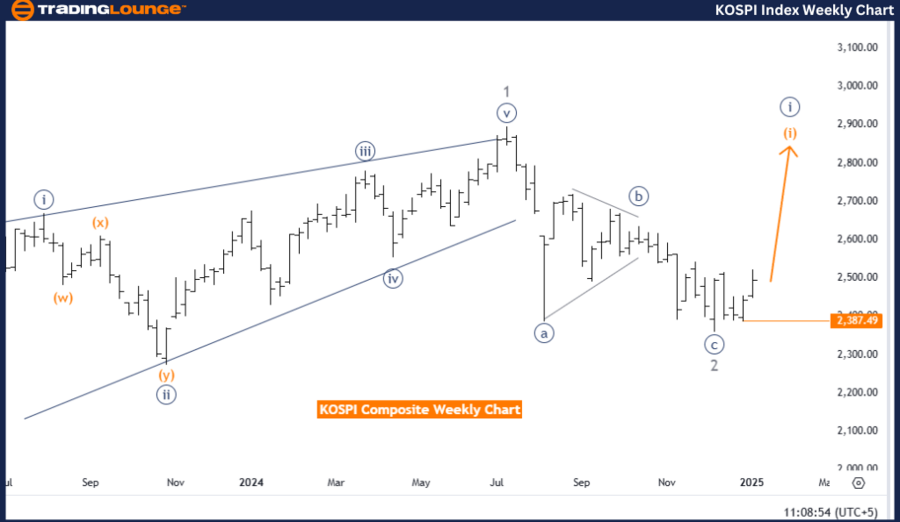
KOSPI Composite Elliott Wave Analysis - Trading Lounge Weekly Chart
KOSPI Composite Elliott Wave Technical Analysis
Function: Bullish Trend
Mode: Impulsive
Structure: Orange Wave 1
Position: Navy Blue Wave 1
Direction Next Lower Degrees: Orange Wave 2
Details: Navy blue wave C of gray wave 2 appears completed; orange wave 1 of navy blue wave 1 is now in progress.
Wave Cancel Invalidation Level: 2,387.49
The weekly chart analysis of the KOSPI Composite Index reveals a bullish trend driven by an impulsive structure. Currently, orange wave 1 is unfolding within the larger navy blue wave 1. The completion of navy blue wave C of gray wave 2 has concluded a corrective phase, setting the stage for orange wave 1 to advance within navy blue wave 1.
This phase reflects the initiation of upward momentum in the larger trend cycle. Once orange wave 1 concludes, the market is expected to transition into orange wave 2, a corrective phase, before resuming the broader bullish trend. This progression underscores the Elliott Wave Theory's principle of alternating impulsive and corrective phases.
An invalidation level is identified at 2,387.49. If the price declines below this point, the wave interpretation will be invalidated, requiring a reevaluation of the wave structure. This level serves as a vital reference to validate the wave analysis.
Summary:
The KOSPI Composite Index is advancing within an impulsive bullish trend, with orange wave 1 developing within navy blue wave 1. The completion of navy blue wave C signifies the end of a corrective phase, paving the way for further upward momentum. The invalidation level at 2,387.49 is a crucial benchmark to confirm the ongoing wave scenario and guide market expectations.
Technical Analyst: Malik Awais
Source: visit Tradinglounge.com and learn From the Experts Join TradingLounge Here
Previous: DOW JONES DJI Elliott Wave Technical Analysis
VALUE Offer - Buy 1 Month & Get 3 Months!Click here
Access 7 Analysts Over 200 Markets Covered. Chat Room With Support