COLES GROUP LIMITED – COL Elliott Wave Technical Analysis | TradingLounge
Our latest Elliott Wave analysis for the Australian Stock Exchange (ASX) focuses on COLES GROUP LIMITED (ASX:COL). The current forecast indicates a potential advancement within the (5)-orange wave, suggesting further upward movement.
There is uncertainty between two key outlooks. However, traders can rely on critical indicators to determine whether a bullish trend is emerging or if the bearish sentiment persists, using a data-driven and logical approach.
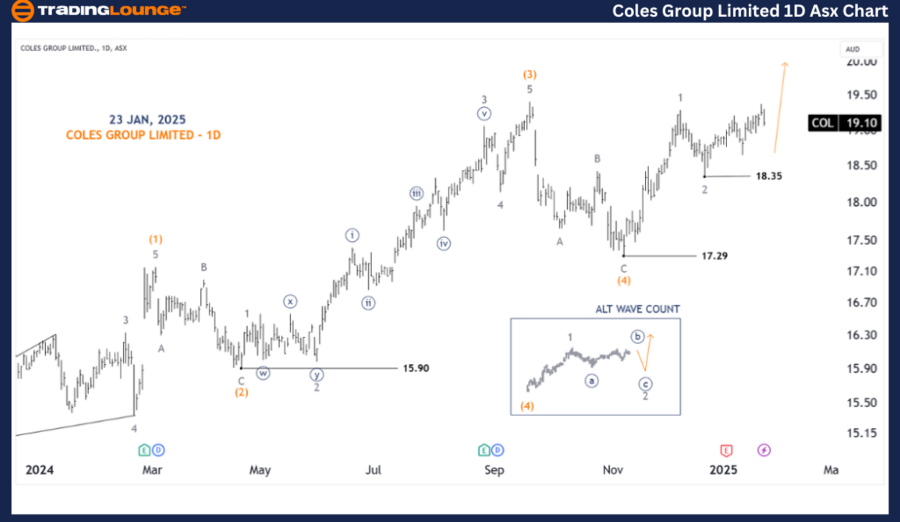
COLES GROUP LIMITED – COL (1D Chart Analysis)
Elliott Wave Technical Analysis
Function: Major trend (Minute degree, navy)
Mode: Motive
Structure: Impulse
Position: Wave 3-grey of Wave (5)-orange
Key Insights:
The primary wave count suggests an upward trend from 18.35, indicating a continuation of the 3-grey wave. However, the lack of sufficient momentum and clarity raises concerns, making the ALT scenario a viable alternative. Investors should closely observe price movements for further validation.
- Invalidation Point: 17.29

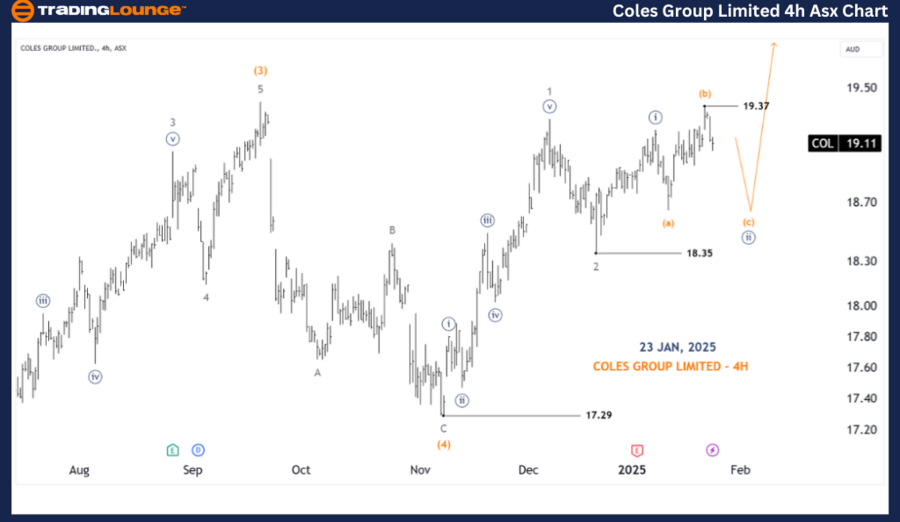
COLES GROUP LIMITED – COL (4-Hour Chart Analysis)
Elliott Wave Technical Analysis
Function: Major trend (Minor degree, grey)
Mode: Motive
Structure: Impulse
Position: Wave 3-grey of Wave (5)-orange
Key Insights:
The upward momentum remains weak, hinting at the possible development of a 2-grey wave. If the price surpasses 19.37, it will confirm the primary bullish scenario. Otherwise, both wave counts remain equally probable.
- Invalidation Point: 18.35
- Confirmation Point: 19.37
Technical Analyst: Hua (Shane) Cuong, CEWA-M (Master’s Designation).
Source: visit Tradinglounge.com and learn From the Experts Join TradingLounge Here
See Previous: RESMED INC - RMD Elliott Wave Technical Analysis
VALUE Offer - Buy 1 Month & Get 3 Months!Click here
Access 7 Analysts Over 200 Markets Covered. Chat Room With Support

Conclusion
This analysis provides valuable insights into the market trends and short-term expectations for COLES GROUP LIMITED (ASX:COL). Our detailed outlook includes critical price levels serving as validation and invalidation markers for the Elliott Wave count. These key levels offer investors greater confidence in decision-making and market positioning.
By incorporating these factors, our analysis presents a balanced, professional perspective on the current market dynamics.