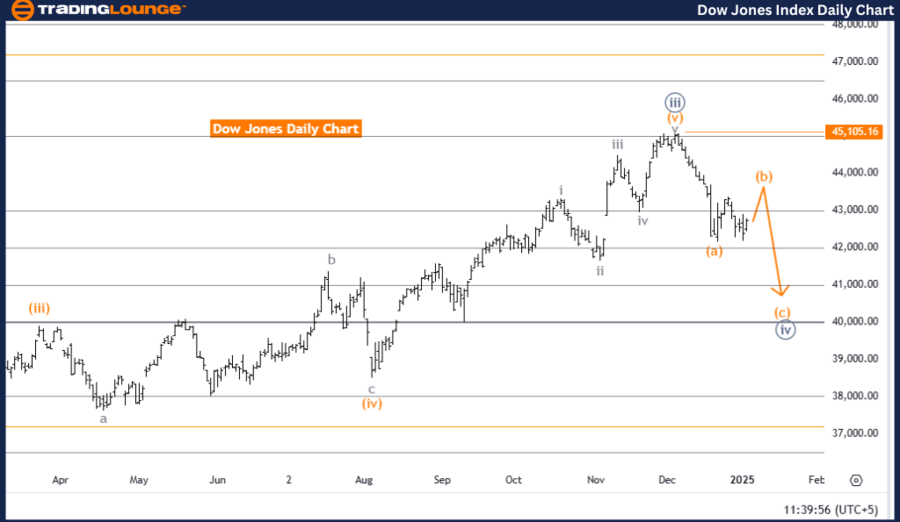
DOW JONES Elliott Wave Analysis - DJI Day Chart
DJI Elliott Wave Technical Analysis
Function: Counter-Trend
Mode: Corrective
Structure: Orange Wave B
Position: Navy Blue Wave 4
Direction Next Lower Degrees: Orange Wave C
Details
Current Status: Orange wave A of navy blue wave 4 appears to be complete, with orange wave B currently unfolding.
Invalidation Level: 45,105.16
Analysis Summary
The Dow Jones Industrial Average (DJI) is in a corrective counter-trend phase as highlighted by Elliott Wave Analysis on the daily chart. This phase centers around orange wave B, part of the broader navy blue wave 4 corrective structure.
- Orange wave A has been completed, initiating the development of orange wave B, which represents a retracement phase within the market's overall cycle.
- The next anticipated move involves orange wave C, signaling further advancement of the corrective phase within navy blue wave 4.
- These waves indicate a period of consolidation and short-term fluctuations before the broader market trend resumes.
Invalidation Level
The invalidation threshold for the current wave count is set at 45,105.16.
- Exceeding this level would invalidate the present wave structure, requiring a reassessment of the analysis.
- This level serves as a critical benchmark for confirming or rejecting the ongoing wave count.
Conclusion
The Dow Jones is progressing through a corrective stage of navy blue wave 4, with orange wave B currently unfolding. This phase underscores short-term market adjustments before transitioning into orange wave C. The invalidation level of 45,105.16 is vital for maintaining the accuracy of this Elliott Wave analysis and preparing for significant upcoming market moves.
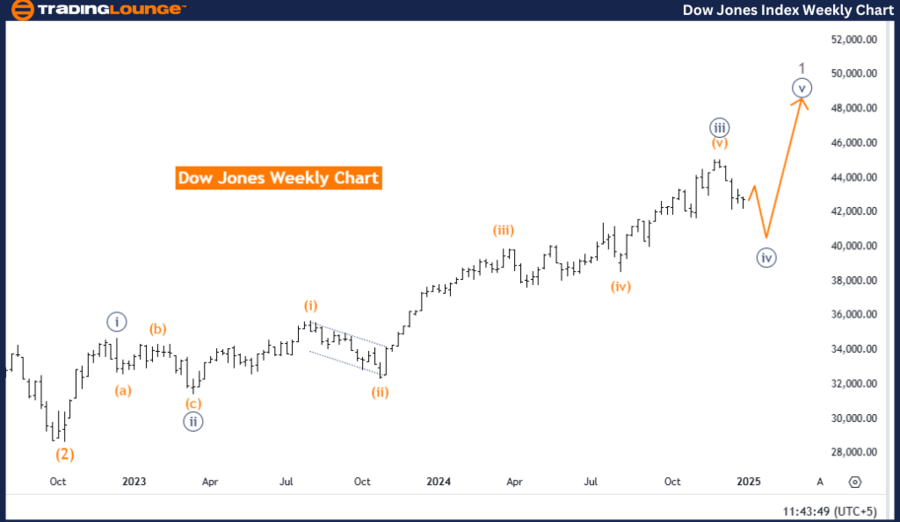
DOW JONES Elliott Wave Analysis - DJI Weekly Chart
DJI Elliott Wave Technical Analysis
Function: Counter-Trend
Mode: Corrective
Structure: Navy Blue Wave 4
Position: Gray Wave 1
Direction Next Higher Degrees: Navy Blue Wave 5
Details
Current Status: Navy blue wave 3 has been completed, and navy blue wave 4 is now actively unfolding.
Analysis Summary
The Dow Jones Industrial Average (DJI) is undergoing a corrective counter-trend phase on the weekly chart, aligning with navy blue wave 4, a component of the larger Elliott Wave structure.
- The completion of navy blue wave 3 signals the start of navy blue wave 4, a retracement phase within the broader upward trend.
- This phase is expected to act as a pause or temporary correction before upward momentum resumes with navy blue wave 5.
Larger Context
The transition from wave 3 to wave 4 is a common occurrence in the Elliott Wave framework, reflecting short-term fluctuations within the broader market trend.
- Upon completion of wave 4, navy blue wave 5 is anticipated to continue the bullish trajectory, maintaining the overall market uptrend.
Significance of Current Phase
Understanding the corrective phase of navy blue wave 4 is crucial for forecasting market behavior.
- This stage presents a strategic opportunity for traders and investors to prepare for the subsequent upward movement with navy blue wave 5.
Conclusion
The Dow Jones is navigating the corrective phase of navy blue wave 4, transitioning from navy blue wave 3. This stage represents a temporary consolidation before resuming the upward trend with wave 5. Market participants can use this phase to position themselves for the next significant directional move.
Technical Analyst: Malik Awais
Source: visit Tradinglounge.com and learn From the Experts Join TradingLounge Here
Previous: IBEX 35 (Spain) Elliott Wave Technical Analysis
VALUE Offer - Buy 1 Month & Get 3 Months!Click here
Access 7 Analysts Over 200 Markets Covered. Chat Room With Support