19Dec

IBEX 35 Trading and Investment Tips: IBEX 35 Elliott Wave Technical Analysis, Market Forecasts, Daily Updates, and Best Stocks

IBEX 35 (Spain) Elliott Wave Analysis - Trading Lounge Daily Chart

IBEX 35 (Spain) Elliott Wave Technical Analysis

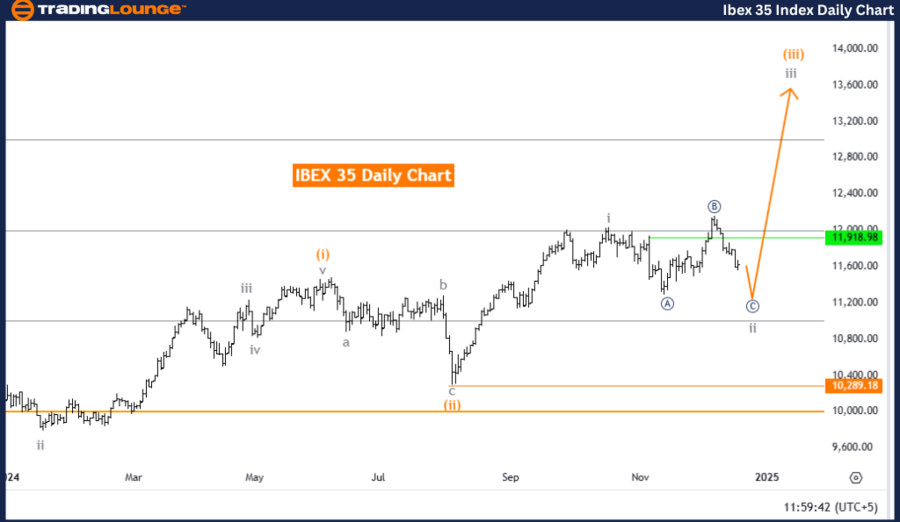
IBEX 35 Daily Chart Technical Analysis

Function: Counter Trend

Mode: Corrective

Structure: Gray wave 2

Position: Orange wave 3

Next Higher Degree Direction: Gray wave 3

Details: Gray wave 1 completed; gray wave 2 of orange wave 3 in progress.

Wave Cancel Invalidation Level: 10,289.18

Analysis Overview

The IBEX 35 daily chart showcases a counter-trend movement within the framework of Elliott Wave theory. The focus is on gray wave 2, which operates as a corrective structure nested within the larger orange wave 3. This phase represents a temporary consolidation, setting the stage for the broader market trend.

Wave Dynamics

  • Completion of Gray Wave 1: Marks the conclusion of the initial impulsive phase.

  • Development of Gray Wave 2: This corrective wave retraces part of the upward movement from gray wave 1.
  • Preparation for Larger Trend: The ongoing corrective phase lays the groundwork for the continuation of the impulsive trend in gray wave 3.

Higher Degree Wave Outlook

The imminent completion of gray wave 2 signals the market’s preparation for a bullish resurgence in gray wave 3. This phase aligns with the Elliott Wave principle of consolidation preceding trend continuation, emphasizing the market's transition back into upward momentum.

Critical Threshold

The wave cancel invalidation level is set at 10,289.18. A breach below this benchmark would invalidate the current wave count, requiring the reevaluation of the Elliott Wave structure and associated projections.

Conclusion

The IBEX 35 daily analysis reflects a counter-trend corrective phase defined by gray wave 2 following the completion of gray wave 1. This period of consolidation serves as a stepping stone for the anticipated bullish continuation in gray wave 3. The defined invalidation level at 10,289.18 remains pivotal for validating this wave structure and ensuring alignment with Elliott Wave principles.

IBEX-35-index-daily-...


IBEX 35 (Spain) Elliott Wave Analysis - TradingLounge Weekly Chart

IBEX 35 (Spain) Elliott Wave Technical Analysis

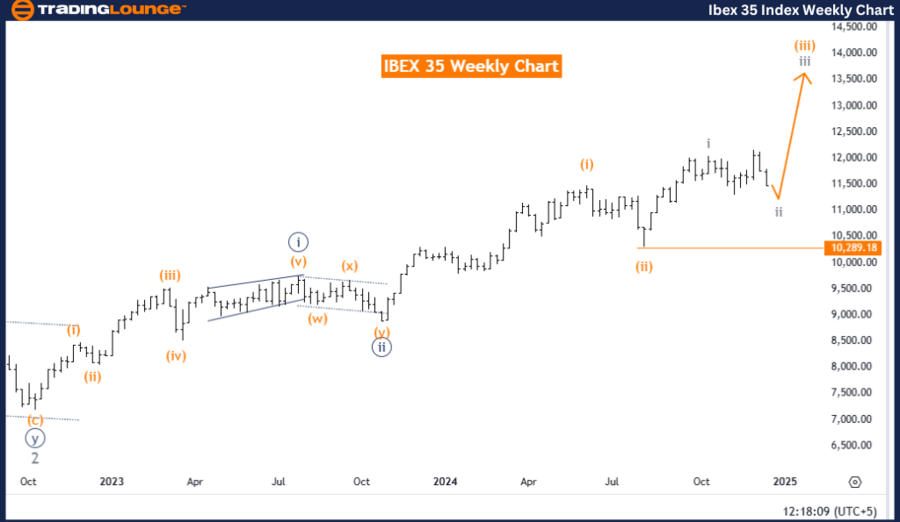
IBEX 35 Technical Analysis

Function: Counter Trend

Mode: Corrective

Structure: Gray wave 2

Position: Orange wave 3

Next Higher Degree Direction: Gray wave 3

Details: Gray wave 1 completed; gray wave 2 of orange wave 3 in progress.

Wave Cancel Invalidation Level: 10,289.18

Analysis Overview

The weekly chart for IBEX 35 reiterates a corrective counter-trend phase defined by gray wave 2, part of the larger orange wave 3. This temporary pause signals a market retracement as part of the broader Elliott Wave impulsive structure.

Wave Dynamics

  • Gray Wave 1 Completion: Marks the starting point of the ongoing corrective wave.

  • Gray Wave 2 Progression: Highlights a pullback within the overall upward trajectory, essential for setting the stage for gray wave 3.
  • Trend Continuation: The corrective phase forms the base for the next impulsive leg, suggesting potential market upside.

Higher Degree Wave Outlook

The next phase, gray wave 3, is projected to reestablish bullish momentum upon the conclusion of gray wave 2. This progression underscores the inherent cyclicality of market trends per Elliott Wave principles.

Critical Threshold

The invalidation level remains pivotal at 10,289.18, serving as a benchmark for reassessing the wave count. Any price movement below this point would necessitate a revised analysis of the current wave structure.

Technical Analyst: Malik Awais

Source: visit Tradinglounge.com and learn From the Experts Join TradingLounge Here 

Previous: S&P BSE Sensex Elliott Wave Technical Analysis

VALUE Offer - Buy 1 Month & Get 3 Months!Click here

Access 7 Analysts Over 200 Markets Covered. Chat Room With Support

IBEX-35-index-weekly...


Conclusion

The weekly chart analysis of IBEX 35 outlines a corrective wave (gray wave 2) following the completion of gray wave 1. This phase within the orange wave 3 structure is pivotal for the market's eventual upward movement into gray wave 3. The 10,289.18 invalidation level acts as a critical point for maintaining the integrity of the Elliott Wave analysis and ensuring accuracy in projections.

Related

NEO/ U.S. dollar(NEOUSD) Elliott Wave Technical Analysis 6 December 23

NEO/ U.S. dollar(NEOUSD) Elliott Wave Technical Analysis 6 December 23

NEO/ U.S. dollar(NEOUSD) Elliott Wave Technical Analysis dated 6 December 23, offers an in-depth per...

Read More >
AAVE Price Forecast: Elliott Wave Signals Wave V Drop, Key Fibonacci Levels, and Smart Trading Strategy for Crypto Short Setups

AAVE Price Forecast: Elliott Wave Signals Wave V Drop, Key Fibonacci Levels, and Smart Trading Strategy for Crypto Short Setups

This analysis provides a detailed Elliott Wave breakdown of AAVE/USD, highlighting current market st...

Read More >
Elliott Wave Analysis of S&P BSE SENSEX NEXT 50 Shows Bullish Trend with Wave 3 in Play and Key Support at 70146

Elliott Wave Analysis of S&P BSE SENSEX NEXT 50 Shows Bullish Trend with Wave 3 in Play and Key Support at 70146

Elliott Wave technical analysis of the S&P BSE SENSEX NEXT 50 shows a strong bullish impulsive struc...

Read More >
Detailed Insights into the Palo Alto Networks Inc.Stock Performance: PANW Stocks Elliott Wave Technical Analysis

Detailed Insights into the Palo Alto Networks Inc.Stock Performance: PANW Stocks Elliott Wave Technical Analysis

Our latest Elliott Wave analysis of Palo Alto Networks Inc. (PANW) offers detailed insights into the...

Read More >

$1 for 2 Weeks

then $29 a month!

What a Special Offer!

Trade Recommendations

Unleash the power of deversified trading with our comprehensive portfolio, covering 250+ markets:

  • Stock Trades
  • Crypto Trades
  • Forex Trades
  • Commodity Trades
Elliott Wave Analysis

Gain a competitive edge with expert insights and AI-powered Elliott Wave charting into:

  • Global Indices
  • US Stocks & ASX Stocks
  • Forex & Crypto
  • Commodities
Top-Notch Trading Tools

Equip yourself with the tools of success:

  • Real-time Chat rooms
  • Elliott Wave Algorithm
  • Portfolio tools
  • TradingLevels
  • Screener
  • Trading Game
7 Elliott Wave Analysts

Stay ahead of the market with daily charts and insightful videos
Your secret to strategic trading!

JOIN HERE


Welcome to TradingLounge (ASIC A.R.No. 321187), specialists in trades, trading education and technical analysis, covering stocks, indices, commodities, forex and cryptocurrencies.

When you join TradingLounge you have access to everything we offer, including trade tools, educational content and a social platform to chat with like-minded investors.

Read more

@Copyright 2024 by tradinglounge.com

Contact Us

Australian no: 02 4787 6020

International no: +61 (2) 47876020

Pay with:

Find us on