18Dec

S&P BSE Sensex (INDIA) Elliott Wave Analysis: Exploring Gray Wave C and Orange Wave 4 in the Current Counter-Trend Movement

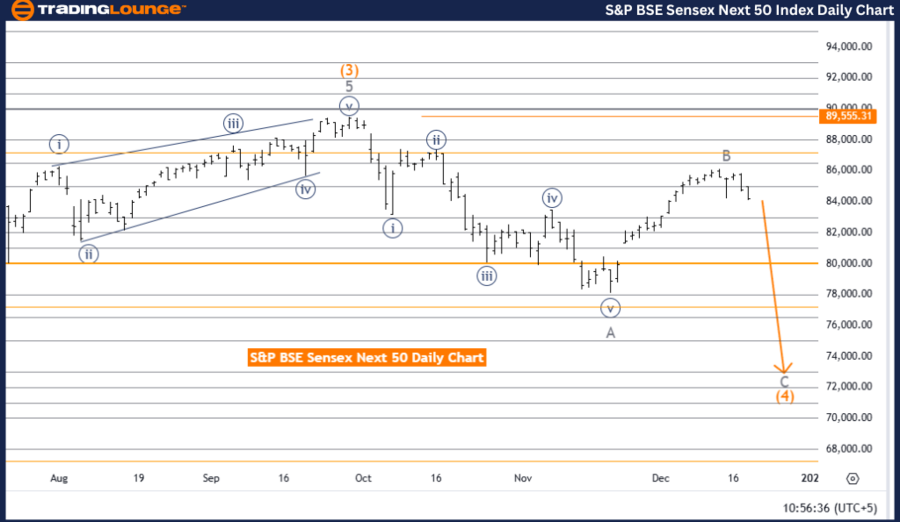
S&P BSE Sensex (INDIA) Elliott Wave Analysis - Trading Lounge Day Chart

S&P BSE Sensex (INDIA) Elliott Wave Technical Analysis

Function: Counter Trend

Mode: Impulsive

Structure: Gray Wave C

Position: Orange Wave 4

Direction Next Higher Degrees: Orange Wave 5

Details: Gray wave B of orange wave 4 is considered complete. Currently, gray wave C of orange wave 4 is in progress.

Wave Cancel Invalid Level: 89,555.31

The daily Elliott Wave analysis for the S&P BSE Sensex highlights a counter-trend phase following the Elliott Wave theory. The ongoing wave structure is impulsive, with gray wave C currently unfolding as part of orange wave 4. This progression signals the continuation of a corrective trend phase.

  • Gray Wave B: Completed, marking the end of the previous corrective phase.
  • Gray Wave C: Actively developing, signaling the market's progression within orange wave 4.

Once gray wave C concludes, the market is expected to transition into orange wave 5, resuming the dominant trend. This phase is integral to the cyclical progression typical of Elliott Wave patterns.

The wave cancel invalid level, set at 89,555.31, is a critical benchmark. A breach above this level would invalidate the current Elliott Wave count for gray wave C of orange wave 4, prompting a reassessment of the analysis. This invalidation point is essential for monitoring risk and maintaining analytical accuracy.

Summary

The S&P BSE Sensex daily chart analysis reveals the following key points:

  • Gray wave B has been completed.
  • Gray wave C is actively developing within orange wave 4.

This counter-trend phase temporarily diverges from the dominant trend but sets the stage for a return to the primary wave structure with orange wave 5. The invalidation level of 89,555.31 serves as a vital reference for evaluating market dynamics.

S&P-BSE-Sensex-Index...


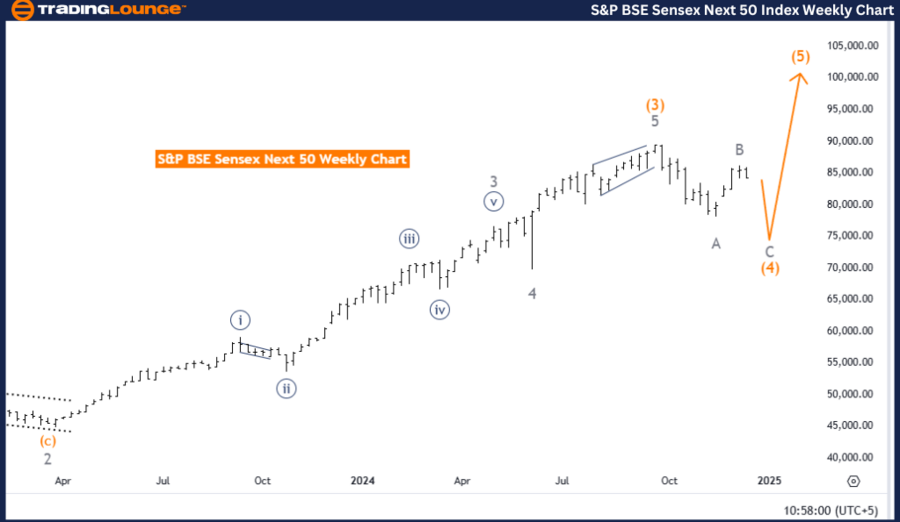
S&P BSE Sensex (INDIA) Elliott Wave Analysis - Trading Lounge Weekly Chart

S&P BSE Sensex (INDIA) Elliott Wave Technical Analysis

Function: Counter Trend

Mode: Impulsive

Structure: Gray Wave C

Position: Orange Wave 4

Direction Next Higher Degrees: Orange Wave 5

Details: Gray wave B of orange wave 4 is complete. Currently, gray wave C of orange wave 4 is in progress.

The weekly analysis of the S&P BSE Sensex focuses on a counter-trend movement within the Elliott Wave framework. The ongoing structure is impulsive, with gray wave C progressing as part of the corrective wave in orange wave 4.

  • Gray Wave B: Completed, marking the end of the prior corrective phase.
  • Gray Wave C: Developing further within orange wave 4 and nearing completion.

Upon the conclusion of gray wave C, the market is expected to transition into orange wave 5, aligning with the broader trend. This phase reflects the cyclical nature of market behavior, where corrective waves are followed by a resumption of the dominant trend.

Summary

The S&P BSE Sensex weekly chart analysis highlights:

  • Completion of gray wave B.
  • Active development of gray wave C within orange wave 4.

This corrective phase, while diverging from the dominant trend, is expected to finalize before transitioning into orange wave 5. This transition will mark the resumption of the broader trend and align with the primary Elliott Wave structure.

Technical Analyst: Malik Awais

Source: visit Tradinglounge.com and learn From the Experts Join TradingLounge Here 

Previous: NIKKEI 225 (N225) Elliott Wave Technical Analysis 

VALUE Offer - Buy 1 Month & Get 3 Months!Click here

Access 7 Analysts Over 200 Markets Covered. Chat Room With Support

S&P-BSE-Sensex-Index...

Related

Following DAX Index News: DAX 40 Stocks Elliott Wave Analysis with Daily and Weekly Chart Forecasts, Technical Outlooks

Following DAX Index News: DAX 40 Stocks Elliott Wave Analysis with Daily and Weekly Chart Forecasts, Technical Outlooks

DAX 40 Elliott Wave analysis covers both daily and weekly chart forecasts. It includes technical out...

Read More >
U.S. Dollar / Japanese Yen Elliott Wave Technical Analysis: Perfect for Forex Traders Seeking Insights into USDJPY Price Movements

U.S. Dollar / Japanese Yen Elliott Wave Technical Analysis: Perfect for Forex Traders Seeking Insights into USDJPY Price Movements

Discover the latest USDJPY Elliott Wave analysis focusing on daily and 4-hour charts. This comprehen...

Read More >
Ethereum Elliott Wave Analysis: Detailed ETHUSD Price Prediction, Support & Resistance Levels, and Market Trends

Ethereum Elliott Wave Analysis: Detailed ETHUSD Price Prediction, Support & Resistance Levels, and Market Trends

Ethereum Elliott Wave analysis to understand ETH/USD price trends, key support and resistance levels...

Read More >
Enhance your investment outcomes in National Australia Bank Limited - NAB Elliott Wave Technical Forecast

Enhance your investment outcomes in National Australia Bank Limited - NAB Elliott Wave Technical Forecast

Discover comprehensive Elliott Wave analysis for ASX: NATIONAL AUSTRALIA BANK LIMITED (NAB). Our in-...

Read More >
GRASIM Industries Bullish Elliott Wave 3 Forecast: Indian Stock Technical Chart Setup with Key Support and Strong Uptrend Signal

GRASIM Industries Bullish Elliott Wave 3 Forecast: Indian Stock Technical Chart Setup with Key Support and Strong Uptrend Signal

GRASIM Industries shows a bullish Elliott Wave structure with wave 3 now active, suggesting strong u...

Read More >
DOW JONES – DJI Index Elliott Wave Forecast Shows Bullish Trend with Wave Count Analysis and Key Invalidation Level at 36,642

DOW JONES – DJI Index Elliott Wave Forecast Shows Bullish Trend with Wave Count Analysis and Key Invalidation Level at 36,642

Dow Jones analysis applies Elliott Wave Theory to identify a strong bullish trend, with active impul...

Read More >

Buy 1 Month

Get 3 Months!

Special Offer:

Trade Recommendations

Unleash the power of deversified trading with our comprehensive portfolio, covering:

  • Stock Trades
  • Crypto Trades
  • Forex Trades
  • Commodity Trades
Elliott Wave Analysis

Gain a competive edge with expert insights in to:

  • Global Indices
  • US Stocks & ASX Stocks
  • Forex & Crypto
  • Commodities
Top-Notch Trading Tools

Equip yourself with the tools of success:

  • Social Chat
  • Elliott Wave Algorithm
  • Screener
  • TradingLevels
  • Trading Game
7 Elliott Wave Analysts

Stay ahead of the market with daily charts and insightful videos
-Your secret to strategic trading!

JOIN HERE


Welcome to TradingLounge (ASIC A.R.No. 321187), specialists in trades, trading education and technical analysis, covering stocks, indices, commodities, forex and cryptocurrencies.

When you join TradingLounge you have access to everything we offer, including trade tools, educational content and a social platform to chat with like-minded investors.

Read more

@Copyright 2024 by tradinglounge.com

Contact Us

Australian no: 02 4787 6020

International no: +61 (2) 47876020

Pay with:

Find us on