GX URA Commodity Elliott Wave Analysis
GX Uranium ETF Elliott Wave Technical Analysis
The Global X Uranium ETF (GX URA) offers investors diversified exposure to the uranium industry, encompassing companies involved in uranium mining, exploration, and production worldwide. With nuclear energy gaining momentum as a cleaner energy source, uranium demand could surge, positioning the GX URA ETF as an attractive option for investors seeking growth opportunities in this evolving sector.
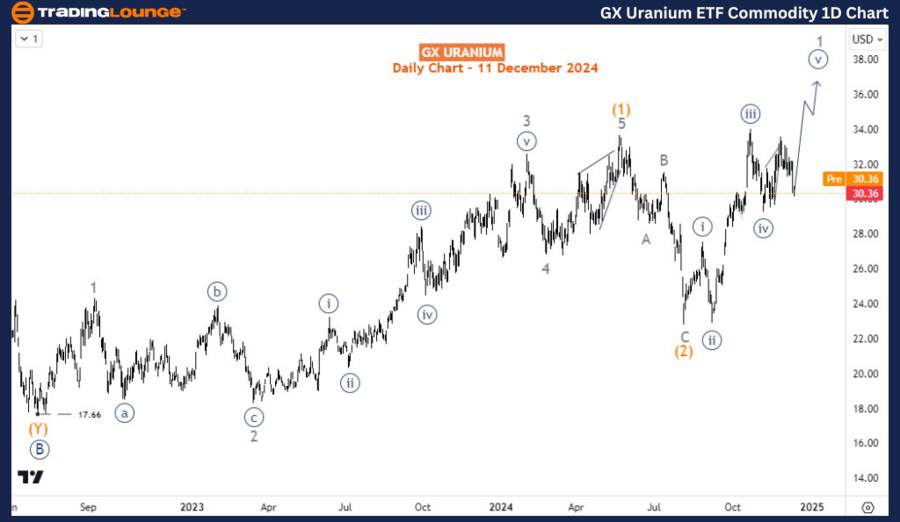
TradingLounge - GX Uranium ETF Commodity Daily Chart Analysis
The GX URA ETF has maintained a bullish trajectory since March 2020, initiating an impulse wave structure that concluded in November 2021. This upward movement has been labeled as wave ((A)) of ((1)). A corrective pullback followed, culminating in a double zigzag structure at $17.66 in July 2022, identified as wave ((B)) or ((2)). Consequently, wave ((C))/((3)) began at $17.66 and is expected to evolve into an impulse structure targeting the $42–$57.30 range.
Currently, as the daily chart indicates, the ETF has completed waves (1) and (2) of ((C))/((3)), with the price now advancing in wave (3).

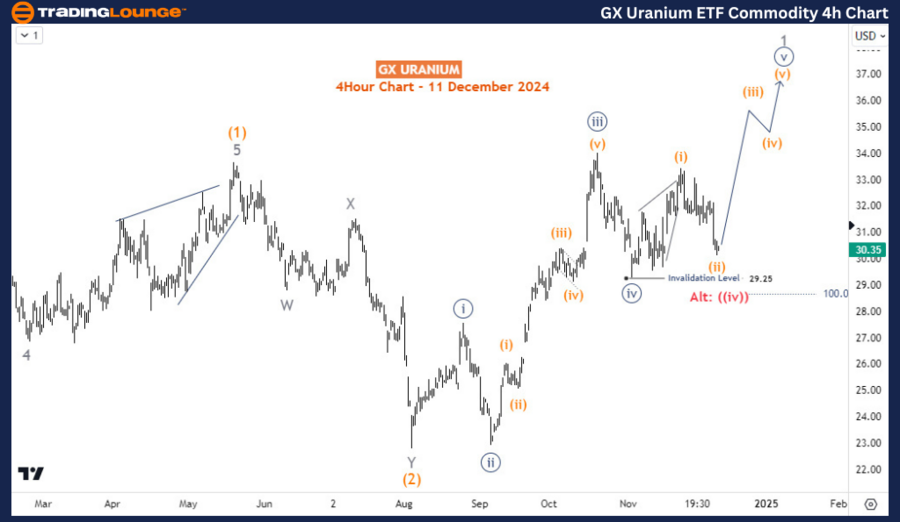
TradingLounge - GX Uranium ETF Commodity H4 Chart Analysis
Wave 1 of (3) appears to be incomplete. On the H4 chart, wave ((iv)) of 1 concluded at $29.25. The current dip is likely wave (ii) of ((v)) as long as the $29.25 support level holds. A break below this level could indicate a lower ((iv)) down to $28.27 or even wave 2. Regardless of this potential scenario, price action remains bullish, favoring an upward continuation both in the short-term and long-term outlook.
Technical Analyst: Sanmi Adeagbo
Source: visit Tradinglounge.com and learn From the Experts Join TradingLounge Here
See Previous: Coffee Elliott Wave Technical Analysis
VALUE Offer - Buy 1 Month & Get 3 Months!Click here
Access 7 Analysts Over 200 Markets Covered. Chat Room With Support
